
The most defensible way to measure marketing ROI is incremental net profit per dollar spent: Incremental Net Profit ROI = (Incremental Revenue − COGS − Marketing Costs) ÷ Marketing Costs × 100. If you can only do one thing today, tag your active campaigns with UTMs, pull cost and revenue data into a single source, and schedule a holdout test for your highest-spend channel. That sequence gives you a verifiable number your CFO will not dismiss.
- Use incremental ROI, not revenue-based ROI, as your primary metric. Revenue-based ROI ignores cost of goods and organic growth, both of which inflate the result.
- Centralize data first. Attribution models are only as reliable as the data feeding them.
- Run an incrementality experiment on your top channel before reallocating budget. A/B holdout tests reveal causal impact that attribution alone cannot prove.
Avinash Kaushik’s Incremental Net Profit ROI is the metric that survives finance and board scrutiny because it ties incremental profit to campaign spend and strips non-working costs.
Pro Tip: Set up a UTM naming convention document this week and share it with every team member who launches campaigns. Inconsistent UTMs are the single most common reason ROI data falls apart at the channel level.
Table of Contents
- What does marketing ROI actually mean for your business?
- How do you calculate marketing ROI with a real example?
- Which KPIs should you track at each funnel stage?
- How do you set up tracking to get clean ROI data?
- What pitfalls skew your ROI numbers?
- Which measurement method should you use and when?
- How do you actually improve marketing ROI?
- What should your ROI report include for stakeholders?
- Key Takeaways
- Why most ROI measurement advice misses the point
- Useful sources and tools to read next
What does marketing ROI actually mean for your business?
Marketing ROI, or return on investment, measures how much profit your marketing activity generates relative to what it costs. The term covers several related but distinct calculations, and using the wrong one is where most teams go wrong.
The four variants you need to know:
- Simple revenue ROI: (Revenue − Marketing Costs) ÷ Marketing Costs × 100. Fast and easy, but it ignores COGS and organic growth.
- Net profit ROI: (Gross Profit − Marketing Costs) ÷ Marketing Costs × 100. Subtracts COGS, giving a more honest margin picture.
- Incremental net profit ROI: Adjusts for organic baseline growth before calculating net profit ROI. This is the version finance teams trust.
- ROAS (Return on Ad Spend): Revenue ÷ Ad Spend. Useful for channel-level efficiency, but not a substitute for true ROI because it excludes all non-ad costs.
Why does the distinction matter to stakeholders? Budget allocation, forecasting, and board credibility all hinge on which number you report. The Marketing Science Institute warns that total ROI can rise while total profit falls, which means a headline ROI percentage can actually mislead budget decisions. Using incremental ROI as a decision tool, rather than a fixed target, tells you whether the next dollar of spend clears your company’s profit threshold.
Business impacts of accurate ROI measurement:
- Justifies budget increases with finance and the C-suite
- Identifies which channels to scale and which to cut
- Improves forecasting accuracy for revenue planning
- Prioritizes conversion rate optimization efforts by showing where margin is lost
- Builds CFO and board credibility by aligning marketing metrics with accounting standards
Benchmarks for “good” ROI vary by channel and business model. A commonly cited rule of thumb is that 3:1 is solid and 5:1 is strong, but those figures are context-dependent. A high-margin SaaS product and a low-margin CPG brand will have very different thresholds for what constitutes a profitable campaign.
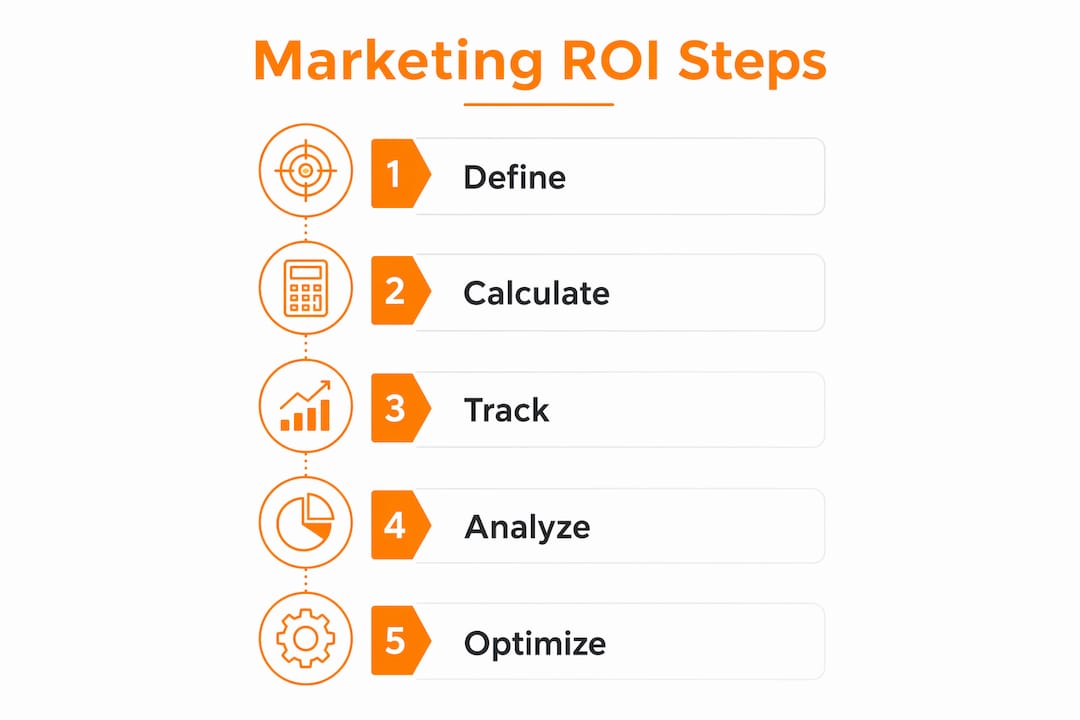
How do you calculate marketing ROI with a real example?
The three formulas every marketer needs
Formula 1: Basic revenue ROI
ROI = (Revenue − Marketing Costs) ÷ Marketing Costs × 100
Formula 2: Net profit ROI
ROI = (Revenue − COGS − Marketing Costs) ÷ Marketing Costs × 100
Formula 3: Incremental net profit ROI (recommended)
ROI = (Incremental Revenue − COGS − Marketing Costs) ÷ Marketing Costs × 100
Incremental revenue is total attributed revenue minus what you would have earned without the campaign (your organic baseline). Stripping that baseline is what separates a credible ROI figure from an inflated one.
What counts as “marketing costs”?
Per Sona’s guidance, fully loaded marketing costs must include:
- Ad spend (paid search, paid social, display, video)
- Agency fees and contractor costs
- Martech platform allocations (your share of CRM, analytics, and automation costs)
- Staff time (prorated salary for hours spent on the campaign)
- Creative production costs (design, video, copywriting)
Leaving out agency fees and staff time is the most common way teams accidentally report inflated ROI.
Worked PPC example: step by step
Suppose you run a Google Ads campaign for one month. Here are the inputs:
| Input | Value |
|---|---|
| Total ad spend | $10,000 |
| Agency management fee | $2,000 |
| Staff time (prorated) | $500 |
| Total marketing cost | $13,500 |
| Attributed revenue | $60,000 |
| COGS | $24,000 |
| Organic baseline revenue | $10,000 |
| Incremental revenue | $50,000 |
Step-by-step calculation:
- Subtract COGS from incremental revenue: $50,000 − $24,000 = $26,000 gross incremental profit
- Subtract total marketing costs: $26,000 − $13,500 = $12,500 net incremental profit
- Divide by total marketing costs: $12,500 ÷ $13,500 = 0.926
- Multiply by 100: ROI = 92.6%
Compare that to the naive revenue-based ROI: ($60,000 − $10,000) ÷ $10,000 × 100 = 500%. The gap between 500% and 92.6% shows exactly why formula choice matters. Investopedia’s worked example demonstrates a similar dynamic: removing organic baseline growth dropped ROI from 50% to 44% in their sample campaign, and that was a relatively modest adjustment.
Pro Tip: Build your ROI calculator in a shared spreadsheet with locked formula cells. When anyone on the team updates inputs, the result recalculates automatically, and you avoid the version-control chaos that corrupts reporting.

Which KPIs should you track at each funnel stage?
Tracking every metric equally is a fast path to analysis paralysis. Organize KPIs by funnel stage so each one maps directly to a specific ROI calculation or optimization decision.
Top-of-funnel (awareness):
- Impressions and reach
- Organic sessions and branded search volume
- Cost per thousand impressions (CPM)
Mid-funnel (consideration and engagement):
- Click-through rate (CTR)
- Lead volume and cost per lead (CPL)
- Conversion rate (visitor to lead)
- Marketing-qualified leads (MQLs)
Bottom-of-funnel (revenue):
- Customer acquisition cost (CAC)
- Cost per acquisition (CPA)
- Customer lifetime value (LTV)
- Gross margin per customer
| Metric | What it reveals about ROI | Where it feeds |
|---|---|---|
| Organic sessions | Organic baseline for incremental calculation | Baseline adjustment |
| CPL | Efficiency of lead generation spend | Channel-level ROI |
| Conversion rate | Leverage point for improving ROI without more spend | CRO prioritization |
| CAC | Total cost to acquire one customer | Net profit ROI denominator |
| LTV | Revenue ceiling per customer relationship | LTV:CAC ratio and budget ceiling |
| Gross margin | Profit available after COGS | Net profit ROI numerator |
LTV deserves particular attention because it changes the ROI math dramatically. A customer worth $2,000 over three years justifies a much higher CAC than one worth $200. Measuring LTV over too short a window understates it; measuring over too long a window overstates it for early-stage businesses where churn is still uncertain. Measuring channel-level ROI separately, rather than relying on blended averages, is what makes LTV-based decisions actionable.
Pro Tip: For LTV, use a 12-month cohort as your baseline and extend to 24 or 36 months only once you have at least two full cohorts of retention data. Projecting LTV beyond your actual data horizon introduces compounding uncertainty.
How do you set up tracking to get clean ROI data?
Clean data is the foundation. Even the best formula produces garbage output if the inputs are inconsistent or incomplete.
Step-by-step tracking checklist
- Define your UTM naming convention. Agree on standard values for
utm_source,utm_medium,utm_campaign,utm_content, andutm_termbefore any campaign launches. Example:utm_source=google / utm_medium=cpc / utm_campaign=q1-brand-awareness. - Implement tracking pixels. Place the Google Tag Manager container on every page, then deploy platform pixels (Meta, LinkedIn, Google Ads) through GTM rather than hardcoding them. This keeps tags auditable.
- Enable server-side tracking where needed. Browser-based tracking loses data to ad blockers and iOS privacy changes. Server-side tracking via GTM server container or a first-party data endpoint recovers a meaningful share of that lost signal.
- Connect CRM revenue to campaign touchpoints. Pass UTM parameters into your CRM (Salesforce, HubSpot, or similar) at the lead creation stage. This links closed-won revenue back to the originating campaign without manual matching.
- Build a centralized data layer. Pull ad platform data, CRM data, and web analytics into a single source. A data warehouse (BigQuery, Snowflake) or a unified analytics layer (Supermetrics, Funnel.io) prevents the fragmentation that thecalcu.com identifies as the primary cause of unreliable ROI figures.
- Validate before reporting. Run a data quality check: confirm UTM coverage rate across sessions, verify pixel firing on key conversion pages, and reconcile ad platform spend against CRM cost records.
UTM quick rules:
- Always use lowercase (Google Analytics treats
Googleandgoogleas separate sources) - Never use spaces (use hyphens instead)
- Be consistent with campaign naming across platforms so channel-level reports aggregate correctly
- Document every convention in a shared naming guide, not just in someone’s head
Data validation checks to run before any ROI report:
- UTM coverage: what percentage of sessions have a source/medium tag? Anything below 85% signals a tracking gap.
- Pixel confirmation: verify conversion events are firing in real time using browser developer tools or the Meta Pixel Helper.
- Spend reconciliation: does the cost pulled from your ad platforms match your invoices and CRM cost fields?
- Revenue reconciliation: does attributed revenue in your analytics tool match closed-won revenue in your CRM for the same period?
What pitfalls skew your ROI numbers?
Most ROI errors are not calculation errors. They are data and framing errors that make the math look right while the answer is wrong.
Common pitfalls and quick fixes:
- Omitting COGS. Reporting revenue-based ROI instead of profit-based ROI inflates the result by the full cost of goods. Fix: always subtract COGS before calculating ROI.
- Ignoring the organic baseline. If your brand grows 10% organically each quarter, attributing all revenue growth to a campaign overstates its impact. Fix: establish a pre-campaign baseline and subtract it from attributed revenue.
- Double-counting touchpoints. Last-click attribution gives 100% credit to the final touchpoint, which means a retargeting ad gets credit for a sale that a blog post or email actually initiated. Fix: use multi-touch attribution or incrementality experiments to distribute credit more accurately.
- Untracked offline conversions. Phone calls, in-store visits, and direct mail responses often go unmeasured, making digital channels look more efficient than they are. Fix: implement call tracking (CallRail, for example) and use unique promo codes for offline channels.
- Excluding agency fees and staff time. This is the most common hidden cost. A campaign with $20,000 in ad spend and $15,000 in agency and staff costs has a very different ROI than one with $20,000 in ad spend alone. Fix: build a fully loaded cost template and require it for every campaign brief.
- Misaligned measurement windows. A B2B campaign with a 90-day sales cycle cannot be fairly evaluated at 30 days. Fix: align your measurement window with your average sales cycle length.
Handling time lag and multi-touch attribution
Time lag is particularly damaging in B2B and high-consideration categories. A prospect who clicks a LinkedIn ad in January may not close until April. If you evaluate that campaign in February, it looks like a failure.
The practical fix is to track pipeline influence rather than closed revenue only. When a campaign touches a deal that enters the pipeline, record that influence. Then apply your average win rate to estimate eventual revenue. It is not a perfect measure, but it gives you a usable signal well before the sales cycle closes. For multi-touch attribution over extended periods, a data-driven attribution model in Google Analytics 4 or a dedicated attribution platform distributes credit across touchpoints based on actual conversion path data rather than arbitrary rules.

Which measurement method should you use and when?
No single measurement method gives you the full picture. BCG’s Four-Legged Stool framework combines four complementary methods to avoid the skewed decisions that come from relying on any one approach.
The four legs:
- Marketing Mix Modeling (MMM): Statistical analysis of historical spend and sales data to estimate the contribution of each channel. Best for long-term budget allocation and upper-funnel channels that are hard to track directly.
- Incrementality experiments: Holdout tests or geo-based experiments that measure causal impact by comparing an exposed group to a control group. The gold standard for proving that marketing caused a result.
- Attribution modeling: Rules-based or data-driven assignment of conversion credit across touchpoints. Best for short-term channel visibility and campaign optimization.
- Customer insights: Qualitative data from surveys, interviews, and brand tracking studies. Provides context that quantitative models miss, such as brand perception shifts or purchase intent changes.
| Method | Best use case | Data required | Timescale | Key trade-off |
|---|---|---|---|---|
| MMM | Long-term budget allocation | 2+ years of spend and sales data | Quarterly to annual | Slow; misses short-term shifts |
| Incrementality experiments | Proving causal impact | Control group, sufficient volume | 2 weeks or more per test | Requires scale; complex to design |
| Attribution modeling | Campaign optimization | Pixel and CRM data | Real-time to weekly | Cannot prove causation |
| Customer insights | Brand equity and qualitative context | Survey or panel data | Monthly to quarterly | Subjective; hard to tie to revenue |
Choosing the right method for your maturity level:
- Early stage (under $500K annual marketing spend): Start with attribution modeling and a basic UTM setup. Run one incrementality experiment per quarter on your top channel.
- Growth stage ($500K–$5M): Add a lightweight MMM annually and run incrementality tests on every major channel before scaling spend.
- Enterprise ($5M+): Operate all four legs simultaneously. MMM informs annual planning, incrementality validates channel decisions, attribution guides weekly optimization, and customer insights feed brand strategy.
The MSI guidance reinforces this: use incremental ROI to test whether an additional dollar of spend returns more than your company’s profit threshold, rather than chasing a single headline percentage.
Pro Tip: Before running an incrementality experiment, confirm you have enough weekly conversions in the test channel to detect a meaningful lift. A channel generating fewer than 50 conversions per week typically needs a longer test window or a geo-based design to reach statistical reliability.
How do you actually improve marketing ROI?
Improving ROI comes down to four levers: increase revenue per customer, reduce acquisition costs, cut non-working spend, or improve margins. Most teams focus only on the first two and leave significant gains on the table.
Prioritized action checklist:
- Optimize your highest-ROAS channels first. Reallocate budget from underperforming channels to those already generating strong returns. This is the fastest ROI improvement with the least risk.
- Improve conversion rates before increasing spend. A 20% improvement in landing page conversion rate has the same effect on CAC as a 20% reduction in CPL, but it costs far less to achieve.
- Cut non-working costs. Audit your martech stack and agency retainers. Tools that are not actively contributing to campaign performance or reporting are pure cost drag.
- Increase average order value or LTV. Upsell sequences, loyalty programs, and subscription models raise the revenue ceiling per customer without increasing acquisition spend.
- Negotiate COGS and fulfillment costs. A 5-point improvement in gross margin improves net profit ROI without touching the marketing budget at all.
A simple test plan for this quarter
A/B test (conversion rate):
- Hypothesis: A revised landing page headline increases form completions by 15%.
- Setup: Split traffic 50/50 between control and variant using Google Optimize or VWO.
- Duration: Run until you reach statistical significance (minimum 200 conversions per variant).
- Decision rule: If the variant wins, roll it out and recalculate channel ROI with the new conversion rate.
Holdout experiment (incrementality):
- Hypothesis: Paid social is driving incremental conversions, not just capturing organic demand.
- Setup: Suppress ads for a randomly selected 10% holdout group for four weeks.
- Measurement: Compare conversion rate between exposed and holdout groups.
- Decision rule: If lift is less than your cost threshold, reallocate budget to a higher-incrementality channel.
Analytics-driven decisions consistently outperform gut-feel budget calls. Analytics in marketing gives teams a structured way to connect test results to budget decisions rather than relying on platform-reported metrics alone.
What should your ROI report include for stakeholders?
A good ROI report answers three questions for every stakeholder: Is marketing profitable? Which channels are working? What should we do differently? The format matters as much as the data.
Report template: what to include
- Headline KPI: Blended incremental net profit ROI for the period
- Channel-level ROI: Individual ROI or ROAS by channel, with spend and attributed revenue
- Incrementality test results: Lift percentage and confidence level from any holdout tests run in the period
- Pipeline metrics: Marketing-sourced pipeline value and marketing’s percentage of total pipeline
- Quality metrics: LTV by acquisition cohort, retention rate, and gross margin trend
- Data caveats: UTM coverage rate, any tracking gaps, and attribution model used
Dashboard visualization suggestions:
- Trend lines for blended ROI and CAC over a rolling 12-month period
- Cohort ROI chart showing ROI by customer acquisition month (reveals LTV trajectory)
- Channel efficiency scatter plot: ROAS on one axis, incremental lift on the other
- Margin-adjusted ROI by product line or customer segment
For stakeholder-ready dashboard examples, marketing reporting dashboards that connect channel data to revenue outcomes are a practical starting point.
Recommended cadence:
| Cadence | Audience | Focus |
|---|---|---|
| Weekly | Marketing team | Campaign performance, spend pacing, conversion rates |
| Monthly | Marketing + sales leadership | Channel ROI, pipeline contribution, CAC trends |
| Quarterly | CMO + CFO + board | MMM results, incremental ROI, LTV cohorts, budget recommendations |
Reporting ownership matters. The marketing operations or analytics function should own data integrity and report production. The CMO owns the narrative and recommendations. Separating those roles prevents the common failure where the person building the report is also the one interpreting it in their own favor.
Integrating customer feedback and qualitative signals into quarterly reviews adds the context that pure ROI numbers miss, particularly for brand equity and purchase intent trends that precede revenue changes by weeks or months.
Key Takeaways
Accurate marketing ROI measurement requires incremental net profit ROI as the baseline metric, fully loaded costs in every calculation, and a combination of attribution, incrementality experiments, and MMM to produce numbers that hold up under finance scrutiny.
| Point | Details |
|---|---|
| Use incremental net profit ROI | Subtract COGS, non-working costs, and organic baseline to get a defensible ROI figure. |
| Include all fully loaded costs | Ad spend alone understates true cost; add agency fees, staff time, martech, and creative production. |
| Run incrementality experiments | Holdout tests prove causal impact that attribution models cannot, especially before scaling spend. |
| Organize KPIs by funnel stage | Track impressions and sessions at the top, CPL and conversion rate at mid, and CAC and LTV at the bottom. |
| Match measurement method to maturity | Early-stage teams start with attribution; growth and enterprise teams layer in MMM and experiments per the Four-Legged Stool. |
Why most ROI measurement advice misses the point
Most guides on this topic stop at the formula. They show you the math, list a few KPIs, and call it done. What they skip is the organizational reality: ROI measurement fails not because marketers do not know the formula, but because the data feeding it is fragmented, the costs are incomplete, and the measurement window does not match the sales cycle.
The teams that get this right share one habit: they treat measurement as a standing operational process, not a quarterly reporting exercise. They have UTM conventions documented and enforced. They run at least one incrementality test per quarter. They reconcile ad platform spend against actual invoices before any number goes into a report. That discipline is what makes the difference between a ROI figure that gets challenged in a board meeting and one that drives a budget increase.
The Four-Legged Stool framework from BCG is the most practical decision tool available for organizations past the early stage. MMM for long-term allocation, incrementality for causal proof, attribution for weekly optimization, and customer insights for qualitative context. No single leg holds the stool up alone. The mistake most marketing teams make is over-investing in attribution because it is the most visible and real-time method, while neglecting the incrementality experiments that would tell them whether their attribution model is even pointing in the right direction.
Brand equity is also systematically undervalued in ROI calculations because it is hard to quantify. But brand perception shifts, measured through tracking surveys or branded search volume trends, often predict revenue changes by four to six weeks. Ignoring them means you are always measuring what already happened rather than what is about to happen.
If you are a marketing leader or business decision-maker who wants a structured audit of your current measurement approach, Theartistevolution’s marketing assessment service is built exactly for that. The agency has worked across healthcare, retail, legal, and CPG categories, and the patterns in measurement gaps are remarkably consistent across industries. The fix is almost always the same: centralize the data, define the cost inputs, and run one honest incrementality test.
Useful sources and tools to read next
The references below support the frameworks and formulas covered in this guide and are worth bookmarking for implementation.
Primary references:
- Avinash Kaushik: Incremental Net Profit ROI — The definitive practitioner case for using incremental net profit ROI as your primary metric, with worked examples and finance-ready framing.
- BCG: Four-Legged Approach to Marketing ROI — The source framework for combining MMM, incrementality, attribution, and customer insights into a single measurement system.
- Marketing Science Institute: ROI as a Decision Tool — Academic and practitioner guidance on using incremental ROI to set investment thresholds rather than chasing headline percentages.
- Investopedia: Measuring Marketing ROI — Clear worked example showing how removing organic baseline growth changes the ROI result.
Practical tracking and analytics tools:
- Google Tag Manager: Free tag management for pixel deployment and UTM tracking.
- Google Analytics 4: Data-driven attribution modeling and conversion path reporting.
- HubSpot / Salesforce: CRM platforms for connecting campaign touchpoints to closed revenue.
- Supermetrics or Funnel.io: Unified data connectors that pull ad platform data into a central warehouse or dashboard.
- BigQuery or Snowflake: Data warehouse options for organizations building a centralized analytics layer.
Theartistevolution resources:
- Campaign management services — Ongoing campaign execution with built-in ROI tracking and reporting.
- PPC management — Paid search and paid social management with channel-level ROI reporting.
- Brand story development case study — Example of how measurement is embedded in brand-level campaign work.
- Marketing tools overview — The martech and analytics stack Theartistevolution uses to centralize data and report ROI for clients.