
Adopt a campaign analytics framework that centers on one north-star KPI, such as incremental revenue or customer LTV. This week, run a KPI mapping workshop that ties every campaign metric to it. Pair it with BCG’s shared KPI currency idea, Google Analytics campaign data import, and the AMA experiment workbook for testing.
TL;DR:
- Use attribution for daily optimization, experiments on the largest budgets or disputed channels to establish causality, and marketing mix modeling for cross channel planning.
- Standardize lowercase UTMs, include source, medium, campaign, and campaign ID, import cost, clicks, and impressions daily, then fix unmatched rows before reporting.
- Keep click through rate, conversion rate, and cost per click as diagnostics; make budget decisions with outcome measures such as incremental sales and ROMI.
- Before launch, define each test’s hypothesis, sample size, measurement method, and decision rule; log flat results so teams do not repeat ineffective tests.
- Review spend pacing and anomalies daily, channel performance weekly, and budget allocation across channels monthly; attach decision rules and assign clear budget approval roles.
Table of Contents
- What does a campaign analytics framework look like from start to finish?
- How do you set objectives and pick north-star KPIs?
- How do you build a KPI hierarchy for channels and creatives?
- How do you collect clean campaign data with UTMs and data import?
- Which measurement methods should you use, and when?
- What should your reporting dashboard show, and who acts on it?
- How do you run a test-and-learn program that sticks?
- What does a 30/90/180 implementation plan look like?
- Where do measurement programs usually go wrong?
- How can we help you run this framework?
- FAQ
- Sources
What does a campaign analytics framework look like from start to finish?
The framework runs through these moves, from goal to learning loop:
- Objective: write the business outcome in one sentence (revenue, leads, retention).
- North-star KPI: pick one or two measures that express that outcome.
- KPI hierarchy: ladder channel, campaign, and creative metrics up to the north star.
- Tag and import data: standardize UTMs and load cost, click, and impression data.
- Choose measurement methods: attribution for daily work, experiments for proof, MMM for planning.
- Report and decide: dashboards with decision rules attached.
- Test and learn: run prioritized experiments and store the results.
The ladder matters most. BCG’s research says leading teams avoid fractured KPI currencies by choosing one or two north-star KPIs that bridge teams, and by aligning marketing KPIs with business outcomes. Click-through rate, cost per click, and conversion rate stay useful, but only as diagnostics that explain movement in the north star.
A cadence keeps the loop alive. Review anomalies and spend pacing daily, channel performance weekly, and cross-channel allocation monthly. Our campaign management framework walks through the operational side of that rhythm.
How do you set objectives and pick north-star KPIs?
Start with the business outcome, not the metric you already have. If the goal is growth, the north star is usually incremental revenue, meaning revenue that would not have happened without the campaign. If the goal is retention, customer LTV is the stronger choice. Lead-driven businesses can use incremental qualified leads, as long as someone agrees on what “qualified” means before launch.
Limit yourself to one or two north stars. When every team brings its own favorite number, you get siloed KPI currencies and arguments about whose report is right. BCG also notes that strong measurement integrates short-term and long-term metrics, so pair a near-term KPI with a longer-horizon one rather than choosing between them.
Here is how that looks in practice:
- Acquisition campaign: north star is incremental revenue; diagnostics are cost per acquisition, conversion rate, and new-customer share.
- Brand campaign: north star is brand lift or share of search; diagnostics are reach, frequency, and branded query volume.
- Retention campaign: north star is customer LTV; diagnostics are repeat purchase rate, churn, and time between orders.
Treat ROMI with care. The AMA’s guidance says ROMI should be derived case by case from its determinants: top-line performance, profit margins, and marketing costs. Our guide to measuring marketing ROI covers those calculations.
Pro Tip: Write each campaign’s north-star KPI and its three diagnostic KPIs on one slide before launch. If a metric cannot point to the north star, drop it from the report.
How do you build a KPI hierarchy for channels and creatives?
Think of the hierarchy as tiers. The top tier is the north star. The middle tier holds campaign and channel outcomes that move it. The bottom tier holds creative and tactical diagnostics that help you fix problems fast.
A sample hierarchy for each campaign type:
- Acquisition: incremental revenue at the top; return on marketing investment and cost per incremental customer by channel; click-through rate, conversion rate, and cost per click by creative.
- Retention: LTV at the top; repeat purchase rate and reactivation rate by channel; open rate and click rate by message.
- Brand: brand lift or share of search at the top; reach and view-through by channel; completion rate and recall by creative.
Prioritize outcome metrics such as ROMI and incremental sales for budget decisions. Keep click-through rate, conversion rate, and cost per click as diagnostics, because a cheap click that never converts looks great in a platform report and does nothing for the north star.
Set targets as percent lifts against a baseline, not as arbitrary round numbers. Use your own historical performance first. Where you have enough history, calibrate with an MMM so targets reflect diminishing returns instead of last quarter’s best week. Review targets monthly, and change them only when the baseline changes, not when a campaign has a bad week.
How do you collect clean campaign data with UTMs and data import?
Bad tagging quietly ruins good analysis. Google’s URL builder guidance calls for consistent, case-sensitive UTM usage, because inconsistent capitalization splits rows and corrupts aggregation. Follow this routine:
- Set one naming convention and publish it: lowercase only, no spaces, one pattern for source, medium, and campaign.
- Always include utm_source, utm_medium, and utm_campaign, and add utm_id when you plan to import campaign data.
- Resolve dynamic parameters in your ad platforms so templates do not output mixed-case or empty values.
- Import cost, clicks, and impressions into your analytics property. Google’s import documentation says aggregated cost, click, and impression data can be joined to session and revenue data, with consistent UTMs and daily imports supported.
- Check the match rate after each import and fix unmatched rows before anyone builds a report.
- Confirm sample sizes before reading a result, and flag any campaign with too little data to trust.
Offline touchpoints need the same discipline. If QR codes, print, or events are in your mix, this offline-to-online attribution guide explains how to stitch those scans back into campaign measurement.
Pro Tip: Keep a UTM registry in a shared spreadsheet and audit it monthly. One stray capital letter can split a campaign into two rows that never get added back together.
Which measurement methods should you use, and when?
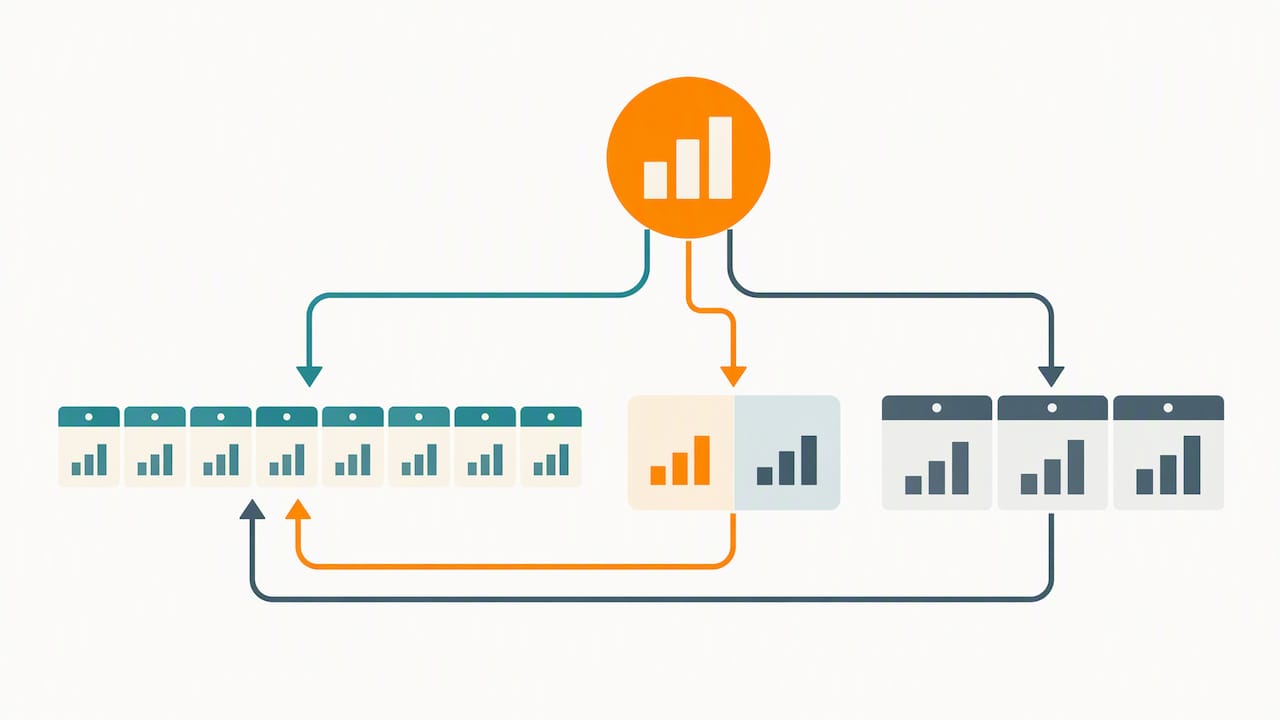
No single method answers every question. Each fills gaps the others leave, and Google’s modern measurement playbook describes the same split: attribution for real-time optimization, incrementality tests for causal validation, and MMM for strategic planning.
- Attribution: useful for daily optimization inside channels and across your analytics platform. Its limit is that it shows which touchpoints got credit, not which ones caused the sale. A Google and DDMA attribution whitepaper advises starting with built-in channel attribution, adding simple cross-channel analyses, and reserving bespoke work for the biggest questions.
- Incrementality experiments: a useful route to causal insight. Use them selectively on your largest budgets and your most debated channels. Our incrementality testing guide covers setup.
- Marketing mix modeling: useful for cross-channel planning and budget allocation. Google’s MMM handbook recommends nested models that include brand and performance KPIs, accounting for adstock and diminishing returns. MMM has granularity limits, so pair it with attribution and experiments for tactical guidance.
- Unified measurement: blends all three into one view that supports continuous learning.
Unified Marketing Measurement blends MMM, MTA, and experiments, often using Bayesian methods, to create one measurement view that supports continuous learning and cross-channel decisions (Think with Google).
The practical mix is simple: attribution for daily operations, experiments for confirmation, and MMM for monthly or quarterly planning. Let experiment results calibrate your attribution and MMM outputs, so the three stop disagreeing.
What should your reporting dashboard show, and who acts on it?
A dashboard earns its place only if each panel triggers a decision. Build these dashboard panels:
- North-star panel: the KPI, its target, and its trend.
- Channel ROI panel: return by channel against the north star.
- Cost and efficiency panel: spend pacing, cost per acquisition, and cost per click.
- Experiment tracker: running tests, status, and readouts.
- Anomaly log: tracking breaks, spend spikes, and unexplained drops.
Assign cadence by role. The media team reviews pacing and anomalies daily. The analytics lead reviews channel performance and experiment status weekly. Marketing leadership and finance review allocation and north-star progress monthly.
Attach decision rules to the numbers. For example, when an experiment reaches its pre-agreed statistical threshold, the winning variant gets scaled. When a channel underperforms its baseline for several consecutive weeks, its budget goes to review. Keep the approval path short: analyst recommends, marketing lead approves, finance confirms any budget move. For layout ideas, see our guides on marketing reporting best practices and reporting dashboards.
How do you run a test-and-learn program that sticks?
Most teams run tests. Few capture what they learned. The AMA Marketing Experiment Planning Workbook gives you a prioritization matrix, an experiment brief template, test readiness checks, and a results tracker. Use that structure:
- Prioritize the backlog by impact, confidence, and ease. Run the high-impact, high-confidence, easy tests first.
- Write the brief before launch: goal, hypothesis, sample size, measurement approach, and decision rule. If you cannot state the decision rule in advance, the test is not ready.
- Run the readiness check: tracking works, audiences are split cleanly, and the test window is long enough.
- Log the result in a shared tracker with the outcome, the effect size, and the confidence level.
- Convert the learning into a change: update targets, creative, or budget, and note which dashboard panel will confirm it.
Pro Tip: Record failed and flat tests too. A clear “no effect” saves the next team from repeating the same experiment.
What does a 30/90/180 implementation plan look like?
Use checkpoints so the framework does not stall after the kickoff meeting.
- Initial checkpoint: audit UTMs, set up daily data import, confirm match rates, and agree on the north-star KPI.
- Next checkpoint: launch the dashboard, load the experiment backlog, and complete prioritized tests.
- Later checkpoint: run a cross-channel MMM-style review and reset budgets and targets from what the tests showed.
| Checkpoint | Core task | Owner |
|---|---|---|
| Initial checkpoint | UTM audit and data import | Analytics lead |
| Next checkpoint | Dashboard live, experiments | Marketing manager |
| Later checkpoint | Cross-channel review and budget reset | Marketing leadership with finance |
Where do measurement programs usually go wrong?
In our experience, the same two problems show up first: fragmented KPI currencies and inconsistent tagging. Sales counts one number, media counts another, and finance trusts neither. We fix this by giving analytics ownership of definitions, media ownership of execution, and finance ownership of the budget decision, with one north-star KPI everyone signs off on. Our case studies show how we structure that work across industries, from healthcare to retail.
— Derek
How can we help you run this framework?
We built our work around exactly this loop. Our Campaign Strategy and Ongoing Management service sets objectives, tagging standards, reporting, and the test calendar, then runs them month after month. Not sure where you stand? Start with a Marketing Assessment. We map your current setup against this framework, recommend a north-star KPI, flag data gaps, and hand you an implementation plan.

Request your assessment on our Strategy & Management page.
FAQ
What are campaign performance metrics?
Campaign performance metrics are the numbers that show how well a campaign is doing against its goal. They include outcome measures such as incremental revenue and ROMI, plus diagnostics like click-through rate, conversion rate, and cost per click. The AMA says ROMI should be derived case by case from top-line performance, profit margins, and marketing costs.
What are the four types of analytics?
Commonly named types include descriptive, diagnostic, predictive, and prescriptive analytics. Descriptive shows what happened, diagnostic shows why, predictive estimates what will happen, and prescriptive recommends what to do. A campaign analytics framework uses all four, from dashboards through budget planning.
How do attribution, incrementality tests, and MMM work together?
Attribution guides daily optimization, incrementality tests confirm what truly caused results, and MMM supports cross-channel planning. Google’s modern measurement playbook describes each tool as filling gaps the others leave. Use test results to calibrate the other two.
How often should you review campaign analytics?
Check pacing and anomalies daily, channel performance weekly, and budget allocation monthly. Run experiments on a rolling backlog and hold a deeper cross-channel review every quarter or so. The rhythm matters more than the exact days, as long as each review ends in a decision.
Sources
- Six Steps to More Effective Marketing Measurement | BCG
- TwG Whitepaper_v5
- URL builders: Collect campaign data with custom URLs – Analytics Help