
Brand lift measurement quantifies whether an ad campaign actually changed how people think and feel about your brand, comparing survey responses from an ad-exposed group against a matched control group that never saw the ad. The result is a causal signal, not a correlation, which is exactly what upper-funnel campaigns need to justify spend.
Use it when:
- You’re running a major awareness buy on YouTube, connected TV, or display
- You’re launching a new product and need to confirm the message landed
- You’re testing creative variants to see which one moves recall or consideration
- You’re running a cross-channel video campaign and need channel-level attribution beyond clicks
A few quick framing points: brand lift studies are survey-based, they complement ROAS and incrementality tests rather than replace them, and they’re most valuable for upper-funnel goals where behavioral metrics like clicks tell you almost nothing about perception change.
Table of Contents
- What brand lift measurement actually measures (and what it doesn’t)
- Core brand-lift metrics to track and what each one reveals
- How brand-lift studies work: methodology, sample size, and what “not enough data” means
- How to run a brand-lift study: a step-by-step checklist
- Best practices and common mistakes in brand lift studies
- How to interpret brand-lift results and set realistic benchmarks
- How a full-service agency runs brand-lift measurement for clients
- Key Takeaways
- The case for treating brand lift as a standing line item, not a one-time test
- Theartistevolution brings measurement discipline to every campaign
- Useful sources and further reading
What brand lift measurement actually measures (and what it doesn’t)
Brand lift measurement isolates the causal impact of advertising by comparing two groups: people who were exposed to your ad and a statistically matched holdout group who weren’t. Both groups receive the same survey. The difference in their responses is your lift.
That’s a fundamentally different question than what clicks, impressions, or ROAS answer. A click tells you someone acted. Brand lift tells you whether the campaign shifted awareness, recall, or intent in the minds of people who saw it, including the vast majority who never clicked anything. For awareness campaigns, that distinction matters because most of your audience will never click an ad, yet the campaign may still be working.
ROAS measures revenue efficiency on a conversion event. Incrementality tests for conversions measure whether a campaign drove more purchases than would have happened anyway. Brand lift measures something earlier in the funnel: did the campaign change perception? All three are legitimate measurement tools. They answer different questions, and the mistake is using one as a proxy for the others.
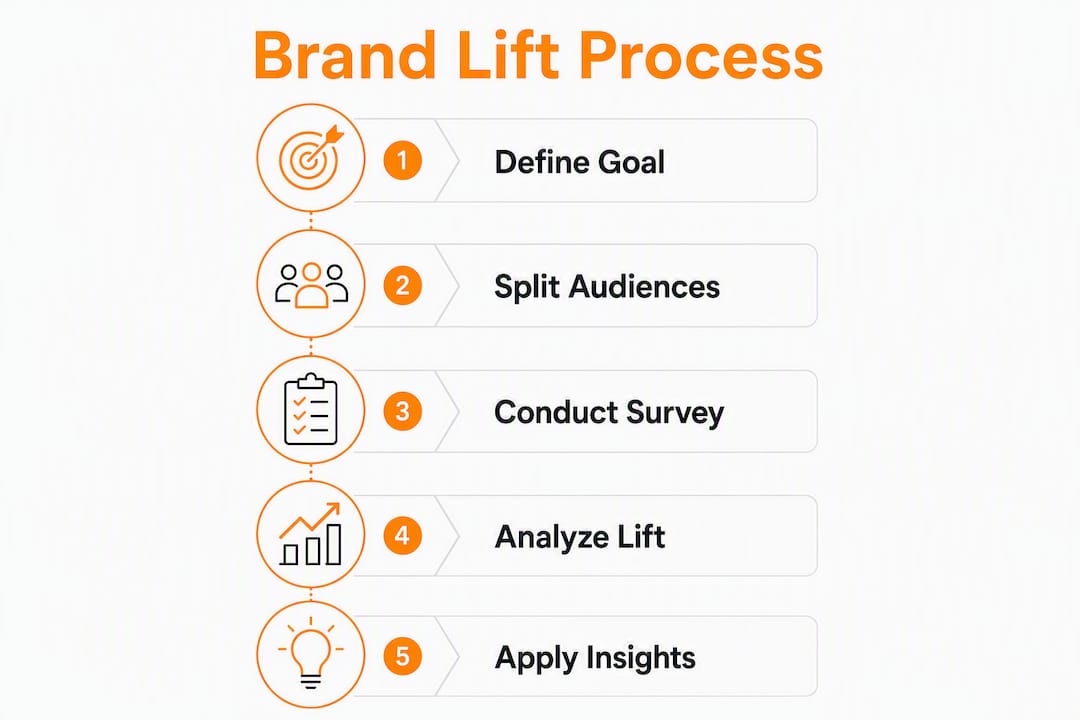
Platform implementations of brand lift include Google Brand Lift within Google Ads and Display & Video 360, Meta Brand Lift, and third-party vendor panels like Dynata and Cint. Each uses the same exposed-versus-control logic, but they differ in how they recruit respondents, how they match groups, and how much cross-platform coverage they offer.
Pro Tip: Run brand lift when your primary campaign objective is awareness, recall, or consideration. When your objective is incremental purchases or leads, a conversion incrementality test is the stronger tool. Use both together on major campaigns to connect perception change to downstream behavior.
Core brand-lift metrics to track and what each one reveals
Not every metric belongs in every study. Picking the right one or two for your campaign objective is what separates a useful study from a noisy one.
Here’s the standard taxonomy:
- Ad recall: Did people remember seeing your ad? This is the most sensitive metric and the fastest to move. It’s a leading indicator of campaign delivery quality, not brand health.
- Brand awareness (aided/unaided): Unaided asks respondents to name brands in a category without prompting. Aided shows them your brand name and asks if they recognize it. Unaided is harder to move and more meaningful for established categories.
- Brand familiarity: How well do people feel they know your brand? Familiarity sits between awareness and favorability and often moves before purchase intent does.
- Brand favorability: Do people have a positive opinion of your brand? This metric is slower to shift and typically requires sustained messaging, not a single campaign.
- Message association: Did the campaign connect a specific claim or attribute to your brand? This is the right metric when you’re launching a new positioning or trying to own a category message.
- Consideration: Would respondents consider your brand the next time they’re in the market? This sits mid-funnel and is a strong predictor of future purchase behavior.
- Purchase intent: Are respondents likely to buy? This is the most downstream lift metric and the hardest to move with a single campaign, especially for high-consideration purchases.
For most campaigns, choose one to three primary metrics aligned to your funnel objective. Platform tools like Google Brand Lift limit the number of survey questions per study, so prioritizing forces clarity. A new brand entering a market should focus on awareness and familiarity. A brand running a repositioning campaign should prioritize message association and favorability. A brand in a high-purchase-frequency category can reasonably track consideration and intent.
Lift metrics don’t live in isolation. Pair them with proxy behavioral signals: branded search volume, direct traffic, and social share of voice. If your awareness lift score rises and branded search volume climbs in the same period, you have corroborating evidence that the perception change is translating into real-world interest. Combining survey lift with proxy metrics gives you both causal evidence and directional trend data, which is a more defensible story for stakeholders than either signal alone.

How brand-lift studies work: methodology, sample size, and what “not enough data” means
The exposed vs. control methodology
When a brand lift study launches, the platform or vendor splits the eligible audience into two groups. The exposed group sees your ads normally. The holdout group is withheld from seeing them. After sufficient exposure, both groups receive a short survey. The difference in positive response rates between the two groups is the absolute lift.

Absolute lift is the raw percentage-point difference. If 42% of the exposed group recalls your ad and 30% of the control group does, your absolute lift is 12 percentage points. Relative lift expresses that same change as a percentage of the baseline: 12 divided by 30 equals 40% relative lift. Both numbers matter. A 5-point absolute lift on a 10% baseline is a 50% relative improvement. The same 5-point lift on a 60% baseline is only an 8% relative improvement, which signals a very different campaign situation.
Sample size, spend thresholds, and detectability
Google’s Brand Lift tool requires minimum campaign spend and impression thresholds before a study becomes eligible. The platform checks eligibility automatically and flags studies that don’t have enough data to produce statistically reliable results. Enhanced Lift collection, which improves detectability for larger studies, requires roughly three times the minimum budget of Standard collection.
| Collection mode | Budget requirement | Survey responses needed | Best for |
|---|---|---|---|
| Standard | Platform minimum | Lower threshold | Mid-size awareness campaigns |
| Enhanced | ~3x Standard minimum | Higher threshold | Large-scale campaigns, segmented reads |
| Third-party panel (Dynata, Cint) | Varies by vendor | Custom per study | Cross-platform, category-level studies |
Smaller campaigns frequently hit the “not enough data” or “ineligible” status. This isn’t a platform error. It means the study didn’t generate enough survey responses to detect a statistically meaningful difference between the two groups. Running an underpowered study wastes budget and produces no usable insight.
Reading confidence intervals, not just headline lift
A 95% confidence interval (CI) tells you the range within which the true lift value likely falls. If your study reports 8% absolute lift with a 95% CI of 2%–14%, the result is statistically significant and directionally clear. If the CI spans from -3% to 19%, the result includes zero, which means you cannot confidently conclude the campaign moved the metric at all.
Always read the CI alongside the headline lift number. Platforms that report only the point estimate without the interval are hiding the uncertainty.
Panel-based vs. cookie-based data integrity
Dynata’s approach uses first-party, opted-in panel respondents who are matched 1:1 to ad exposure records. This reduces the contamination risk that comes with cookie-based or device-based matching, where the same person can appear in both the exposed and control cohorts across devices. Panel-based measurement is the stronger standard for bias control, particularly for cross-platform studies where device graphs are imprecise.
Pro Tip: Before launching, check your campaign’s eligibility status in the platform interface. If you’re close to the minimum threshold, consider consolidating ad groups or extending the study window rather than launching an underpowered study that returns no data.
How to run a brand-lift study: a step-by-step checklist
Getting the setup right before launch prevents the most common failures: underpowered studies, contaminated holdouts, and misaligned metrics.
-
Define your primary objective. Choose one funnel stage: awareness, recall, familiarity, consideration, or intent. The objective determines which survey question you’ll prioritize.
-
Select one to three lift metrics. Match them to the objective. Don’t measure everything. Platform tools limit question count, and fewer metrics produce cleaner, more actionable reads.
-
Set your hypothesis. Write it down: “This campaign will increase aided brand awareness among adults 25–44 by at least X percentage points.” A written hypothesis prevents post-hoc rationalization of results.
-
Choose your platform or vendor. Use Google Brand Lift or DV360 for YouTube and display campaigns where Google inventory dominates. Use Meta Brand Lift for Facebook and Instagram campaigns. Use third-party panels like Dynata or Cint when you need cross-platform coverage, category-level benchmarks, or more control over respondent recruitment. Platform-level tools are lower cost and faster to launch; vendor panels offer more flexibility and cross-channel scope.
-
Confirm budget eligibility. Check the platform’s minimum spend and impression requirements before launch. For Google Brand Lift, the interface flags eligibility. Plan for at least a 10-day minimum spend window; shorter windows rarely generate enough responses.
-
Design your survey questions. Keep questions to three or fewer. Use neutral wording. “Which of the following brands have you heard of?” is cleaner than “Have you heard of [Brand], the leader in X?” Leading questions inflate lift scores and produce unreliable data.
-
Establish a baseline where possible. If you run continuous brand tracking surveys, record the pre-campaign baseline for your primary metric. This gives you a reference point beyond the study’s internal control group.
-
Launch and monitor. Check eligibility status in the first few days. If the study flags as ineligible, investigate spend pacing and impression volume before the window closes.
-
Segment your results. Don’t read only aggregate lift. Break results by demographic, creative variant, placement, and device. Aggregate lift can mask the fact that one creative drove all the movement while another performed flat.
-
Document and share findings. Prepare a one-page summary: primary metric lift, CI, segmented reads, and proxy metric trends during the same period. Share with media, creative, and brand strategy teams simultaneously.
-
Plan re-measurement. After significant creative or media changes, re-run the study. Re-measurement reveals whether the change actually moved the metric and enables iterative optimization rather than one-time reporting.
Best practices and common mistakes in brand lift studies
What works
- Align the metric to the campaign objective before launch. A campaign built for awareness should measure awareness, not purchase intent. Misalignment produces technically valid but strategically useless data.
- Use proper holdouts. The control group must be genuinely unexposed. Audience overlap between campaigns running simultaneously contaminates the holdout and inflates or deflates lift scores unpredictably.
- Segment results by creative and audience. Aggregate lift is a starting point, not a conclusion. Segmenting by demographic, creative, and placement reveals which messages actually moved which audiences, which is the information you need to optimize.
- Combine lift with proxy metrics. Branded search volume, direct traffic, and social share of voice provide continuous directional signals between formal lift studies. Use them together.
- Re-measure after major changes. Creative refreshes, new placements, and budget shifts all affect lift. Re-running a study after a significant change is the only way to know whether the change helped.
What to avoid
- Relying solely on ROAS for awareness campaigns. ROAS measures conversion efficiency. It tells you nothing about whether the campaign changed brand perception. Using it as the primary success metric for an awareness buy is a category error.
- Running underpowered studies. A study that returns “not enough data” produces zero insight and wastes the budget allocated to the holdout. Size the study to the platform’s minimum before launch.
- Survey contamination. If your exposed and control groups overlap because of cross-device exposure or simultaneous campaigns, the lift score is unreliable. Panel-based vendors with 1:1 respondent matching reduce this risk significantly.
- Poor question wording. Leading questions, double-barreled questions, and brand-name-first framing all introduce response bias. Test question wording before the study launches.
- Misreading statistical noise as real lift. A lift number with a wide confidence interval that spans zero is not a positive result. Report the CI alongside the headline number every time.
Pro Tip: After you get your first lift results, segment by frequency of exposure. Audiences who saw the ad three to five times often show meaningfully different lift than those who saw it once. This read tells you whether your frequency cap is set correctly.
How to interpret brand-lift results and set realistic benchmarks
Absolute vs. relative lift: which number to lead with
Absolute lift is the more honest number for stakeholder reporting. A 6-point absolute lift in aided awareness means six more people out of every hundred now recognize your brand after seeing the campaign. Relative lift sounds more impressive (a 6-point gain on a 20% baseline is 30% relative lift) but can mislead when baselines are low.
Baseline awareness level shapes everything. A brand with 15% baseline awareness has more room to move than one at 65%. Expecting the same absolute lift across both situations is unrealistic. Category norms matter too: fast-moving consumer goods campaigns in competitive categories typically see smaller absolute awareness lifts than niche B2B campaigns targeting smaller, less-saturated audiences.
Rough benchmarks
No universal benchmark applies across all categories, budgets, and audiences. That said, practitioners generally treat the following as rough orientation points:
- Brand awareness: — Small to moderate gains are typical for a single campaign flight. Very large awareness gains from a single campaign are uncommon except for brands with very low starting awareness.
These are orientation ranges, not guarantees. Always compare your results against your own historical benchmarks first, then against category norms if your vendor provides them.
Cost-per-lifted-user
Cost-per-lifted-user (CPLU) is a useful efficiency metric for comparing campaigns. Divide total campaign spend by the estimated number of people whose perception was lifted. If a campaign reached a large audience and produced measurable absolute lift, you can estimate the number of people influenced and calculate cost-per-lifted-user for efficiency comparison. Run the same calculation across campaigns and you can rank them by perception efficiency, not just delivery efficiency.
Connecting lift to downstream signals
Lift findings gain credibility when corroborated by behavioral signals. After a campaign that shows meaningful awareness or consideration lift, look for corresponding changes in branded search volume, direct site traffic, and conversion rates on branded keywords. Connecting awareness gains to downstream ROI is the step that turns a brand lift report into a business case. The lift study provides the causal evidence; the proxy metrics provide the scale and continuity.
How a full-service agency runs brand-lift measurement for clients
The engagement structure
A well-run agency brand-lift engagement starts with a measurement plan written before the campaign launches. That plan specifies the primary lift metric, the hypothesis, the platform or vendor, the survey questions, the minimum spend window, and the proxy metrics that will run in parallel. Without a pre-launch plan, results get interpreted retroactively, which is where confirmation bias enters.
For a mid-market retail client running a YouTube awareness campaign, for example, the measurement setup might look like this: aided brand awareness as the primary metric, ad recall as a secondary diagnostic, Google Brand Lift via DV360 as the platform tool, and branded search volume and direct traffic as continuous proxy signals. The study runs for the full campaign flight. Results are segmented by creative variant and audience demographic before any optimization decisions are made.
Dashboard signals and reporting cadence
Effective measurement dashboards combine survey lift results with proxy metrics in a single view. Survey data arrives at the end of the study window. Proxy metrics update continuously. The combination gives teams both a causal read (did the campaign change perception?) and a real-time directional signal (is branded interest growing?). Tracking data insights across both sources prevents the common mistake of waiting for the lift study to close before making any optimization decisions.
Re-measurement is built into the cadence. After a creative refresh or a significant media mix change, the study runs again. This is how agencies build iterative evidence rather than one-time snapshots.
Stakeholder presentation
Lift results should reach media, creative, and brand strategy teams at the same time. Media teams need the segmented placement and frequency reads. Creative teams need the creative-variant breakdown. Brand strategy needs the metric-level trend and the comparison against prior studies. Presenting aggregate lift only to a single stakeholder group wastes the diagnostic value of the study.
A tactical briefing template for vendors and platforms
When briefing a vendor or platform for a lift study, include:
- Campaign objective and primary lift metric
- Target audience definition and estimated reach
- Campaign flight dates and minimum spend window
- Survey questions (draft, for vendor review)
- Segmentation requirements (creative, demographic, placement)
- Reporting format and delivery timeline
- Proxy metrics to be tracked in parallel
Pro Tip: Ask your vendor or platform for category benchmarks at the briefing stage. Knowing the typical ad recall range for your category before the study launches sets realistic expectations and prevents stakeholder disappointment when results are directionally positive but not dramatic.
Key Takeaways
Brand lift measurement gives you causal evidence that your campaign changed perception, which no click or conversion metric can provide on its own.
| Point | Details |
|---|---|
| Causal, not correlational | Brand lift compares exposed vs. control groups to isolate the campaign’s actual effect on awareness, recall, or intent. |
| Match metric to objective | Choose one to three lift metrics aligned to your funnel stage; misaligned metrics produce valid but useless data. |
| Size the study correctly | Underpowered studies return “not enough data” and waste budget; confirm platform eligibility before launch. |
| Read the confidence interval | A lift number with a CI that spans zero is not a positive result; always report the interval alongside the headline figure. |
| Theartistevolution integrates lift into full-campaign reporting | The agency combines survey lift, proxy metrics, and segmented creative reads to connect perception change to business outcomes. |
The case for treating brand lift as a standing line item, not a one-time test
Most marketing teams run a brand lift study once, get a number, and move on. That’s the wrong model. Brand lift is most useful as a recurring diagnostic, not a one-time proof point.
Here’s the honest trade-off: formal lift studies require meaningful spend to reach platform eligibility thresholds. For teams with tighter budgets, that’s a real constraint. The practical answer isn’t to skip measurement entirely. It’s to run proxy metrics continuously (branded search volume, direct traffic, share of voice) and reserve formal lift studies for the campaigns where the spend is large enough to generate reliable data. That combination gives you both causal evidence when you need it and directional trend data year-round.
The cadence question comes up constantly. A reasonable starting point: run a formal lift study on every major awareness campaign above your platform’s eligibility threshold, re-measure after significant creative or media changes, and use proxy metrics to fill the gaps between studies. For most mid-market advertisers, that means two to four formal studies per year, not twelve.
One thing that gets underestimated: the segmented read is often more valuable than the aggregate lift number. Knowing that your 35–44 demographic showed 11-point awareness lift while your 18–24 segment showed 2 points tells you something specific about creative resonance and audience fit. That’s an optimization signal, not just a reporting metric. Teams that read only the top-line number are leaving the most useful part of the study on the table.
Theartistevolution brings measurement discipline to every campaign
Knowing what brand lift measures is one thing. Building the infrastructure to run studies consistently, interpret results correctly, and connect perception data to real business outcomes is where most teams need support.
Theartistevolution is a full-service marketing agency with over 18 years of experience managing campaigns for brands in retail, healthcare, legal, and entertainment. The agency’s brand development services and campaign management programs are built around measurable outcomes, not just delivery metrics.
For clients who need brand lift integrated into their broader reporting stack, the agency handles measurement planning, vendor coordination, dashboard setup, and re-measurement cadence as part of ongoing campaign management. The brand story development case studies show how the agency translates lift findings into creative and media decisions that move the needle.
If you’re ready to run your first lift study or want a full measurement audit of your current program, contact Theartistevolution to schedule a marketing assessment and get a plan built around your specific campaign goals.
Useful sources and further reading
The sources below were used to build this guide. Each is annotated so you know what it’s most useful for.
-
Brand Lift measurement (Google Ads Help): The primary platform reference for Google Brand Lift setup, metric definitions, Standard vs. Enhanced collection modes, and segmentation options. Use this for eligibility rules and survey design guidance.
-
Understand your Brand Lift measurement data (Display & Video 360 Help): The DV360-specific reference for reading lift data, understanding sample-size requirements, and interpreting “not enough data” statuses. Use this for campaign eligibility and data interpretation within DV360.
-
Brand Lift Measurement: Key Metrics for Campaign Success (Dynata): Dynata’s explanation of first-party panel methodology, metric definitions, and dashboard structure. Use this for vendor panel trade-offs and bias-control methodology.
-
Why You Need Brand Lift Studies (Dynata): A strategic framing piece on why brand lift studies are necessary for connecting media investment to brand growth. Useful for justifying lift measurement to stakeholders.
-
Brand Lift: Meta, Google & Survey Studies Explained (AdLibrary): A practical comparison of platform-level brand lift tools and vendor panels, covering cost, scale, and cross-platform coverage trade-offs. Use this for vendor selection guidance.
-
Brand awareness metrics: 8 KPIs (MetricNexus): A dashboard-oriented guide to proxy metrics including branded search, direct traffic, social mentions, and share of voice. Use this for continuous tracking recommendations alongside formal lift studies.
-
Brand awareness measurement and proxies (Benly.ai): Guidance on using proxy metrics for smaller budgets where formal lift studies may not be feasible. Use this for practical alternatives and directional measurement advice.
-
How to measure brand awareness using AI analytics (Babylove Growth): A partner resource covering AI-assisted approaches to brand awareness monitoring, useful for teams looking to automate proxy metric tracking alongside formal lift studies.