
Page speed SEO is the practice of optimizing how fast your pages load and respond so that Google’s Core Web Vitals signals work in your favor, not against you. The single most useful first move is to open Google Search Console’s Core Web Vitals report and identify which metric is labeled “Poor” across the most URLs. That one metric is your roadmap.
Before anything else, run these three steps:
- Test field data first. Pull real-user CrUX data from Search Console or PageSpeed Insights — lab scores alone won’t tell you what Google sees.
- Find your largest LCP element. Use PageSpeed Insights or Lighthouse to identify the image, text block, or video that triggers your Largest Contentful Paint.
- Audit third-party scripts. Open WebPageTest’s waterfall and count every tag firing on load — analytics, chat widgets, ad pixels — because these are often the hidden culprits behind slow INP and LCP.
Key Takeaways
Page speed SEO is won or lost on three field-data metrics — LCP, INP, and CLS — evaluated at the 75th percentile of real users, not on a Lighthouse score.
| Point | Details |
|---|---|
| Fix “Poor” URLs first | Sort by impressions in Search Console and address the highest-traffic templates before anything else. |
| Field data drives ranking | Google uses CrUX data, not Lighthouse scores; always validate improvements against Search Console’s Core Web Vitals report. |
| Quick wins deliver fast ROI | Image compression, CDN deployment, and a third-party tag audit can be done in days and often move the needle the most. |
| Expect a 4–8 week lag | CrUX uses a rolling 28-day window, so field data improvements appear 4–8 weeks after fixes go live. |
| Theartistevolution | Offers structured speed audits, prioritized roadmaps, and ongoing monitoring for businesses that need expert execution. |
Table of Contents
- What does page speed actually measure for SEO?
- Why page speed matters for SEO rankings and revenue
- How to test page speed: lab data vs. field data
- Practical fixes that improve page speed for SEO
- How to prioritize fixes and track progress
- Tool reference: what to run and what to look for
- Why chasing a perfect score is usually the wrong goal
- An agency-style prioritization framework: 7-day and 90-day plans
- Theartistevolution’s page speed and SEO services
- Sources
What does page speed actually measure for SEO?
“Page speed” is an umbrella phrase, not a single number. Google does not rank pages on a generic speed score. It ranks them, in part, on three specific signals called Core Web Vitals: Largest Contentful Paint (LCP), Interaction to Next Paint (INP), and Cumulative Layout Shift (CLS). Each one measures a distinct dimension of the user experience.
LCP measures how long it takes for the largest visible element on the page to render. That element is usually a hero image, a large heading, or an above-the-fold video. INP replaced First Input Delay in 2024 and measures the slowest interaction across an entire visit, not just the first click. It is harder to pass than its predecessor because it captures every button press, form field, and menu tap. CLS measures how much the layout shifts unexpectedly while the page loads, the kind of jump that makes you click the wrong link.
Google evaluates these metrics at the 75th percentile of real users over a rolling 28-day window, using data from the Chrome User Experience Report (CrUX). Mobile assessments carry the most weight because Google indexes mobile-first.
| Metric | Good | Needs Improvement | Poor |
|---|---|---|---|
| LCP | ≤ 2.5s | 2.5 seconds to 4 seconds | > 4 seconds |
| INP | ≤ 200ms | 200 milliseconds or more | > 200 milliseconds |
| CLS | ≤ 0.1 | 0.1 to 0.2 | > 0.1 |
Stat to know: Google evaluates Core Web Vitals at the 75th percentile, meaning 75% of your real users must hit “Good” thresholds before a URL is classified as passing — not just the average visitor.
Why page speed matters for SEO rankings and revenue
Core Web Vitals function as a tiebreaker in Google’s ranking system. When two pages compete on content quality and relevance, the faster one tends to win. Google has been explicit that content quality remains the dominant signal, so a slow page with exceptional content will still outrank a fast page with thin content. But in competitive verticals where content parity is common, CWV can be the deciding factor.
The indirect effects are where speed’s impact becomes undeniable:
- Bounce rate: Slow pages push users back to the search results, a behavior Google interprets as a signal that the page didn’t satisfy the query.
- Crawl efficiency: Googlebot has a crawl budget. Slow server response times mean fewer pages get crawled per session, which can delay indexing for large sites.
- Conversions: Research shows a significant drop in conversions for every additional second of load time, and many mobile users abandon a page that takes longer than a few seconds to load.
- Ad Quality Score: For paid campaigns, landing page speed directly affects Google Ads Quality Score, which influences cost-per-click and ad placement.
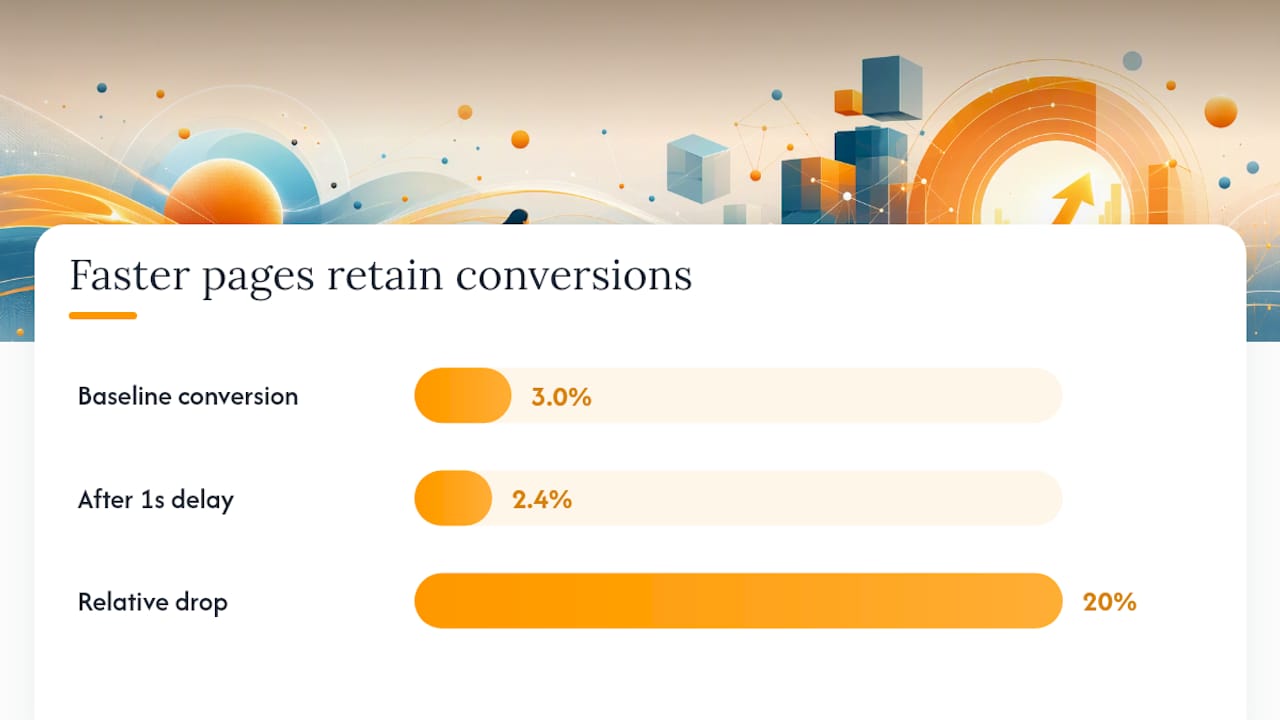
The conversion math is stark: if your landing page converts at 3% today and a one-second delay cuts that by 20%, you’re effectively running at 2.4% — a gap that compounds across thousands of monthly visitors.
Pairing speed improvements with broader technical SEO priorities amplifies both signals together.
How to test page speed: lab data vs. field data
The most common mistake marketers make is optimizing for a Lighthouse score and calling it done. Google uses only field data from CrUX for ranking, not Lighthouse lab scores. Lighthouse is a diagnostic tool — excellent for finding what to fix, but not a proxy for what Google actually measures.
Here’s how the two data types differ:
| Data Type | Source | Strengths | Limitations |
|---|---|---|---|
| Lab data | Lighthouse, WebPageTest, GTmetrix | Reproducible, detailed, fast to run | Simulated conditions; no real users |
| Field data | CrUX, Search Console, PageSpeed Insights | Real users, real devices, real networks | 28-day lag; needs sufficient traffic |
Which tool to use and when:
- PageSpeed Insights: Paste any URL to get both CrUX field data and a Lighthouse lab report in one view. Start here for a quick read on any page.
- Lighthouse: Run it in Chrome DevTools or via CLI for detailed diagnostics during development. Use it to identify the LCP element and long tasks.
- Chrome UX Report (CrUX) / Search Console: The Core Web Vitals report in Search Console groups URLs by template type (product pages, blog posts, etc.), which makes it far more useful than single-URL testing for large sites.
- WebPageTest: The best tool for waterfall analysis. Paste a URL, select a device and connection, and examine which resources block rendering. Particularly useful for diagnosing slow LCP or long main-thread tasks.
- GTmetrix: Useful for historical tracking and scheduled monitoring. Its Waterfall tab mirrors WebPageTest’s depth for most use cases.
- Semrush Site Audit: Surfaces speed-related issues at scale across an entire domain, useful for identifying which templates are failing rather than which individual URLs.
Pro Tip: When Search Console shows a “Poor” cluster affecting hundreds of URLs, the problem is almost always a template-level issue, not a single page. Run WebPageTest on one representative URL from that cluster to find the shared bottleneck, then fix it at the template level.
Practical fixes that improve page speed for SEO
Start with diagnostics: identify the dominant failing metric in Search Console, then use WebPageTest’s waterfall to find the specific resource causing it. Fix the highest-traffic templates first.
Quick wins (hours to one day)
- Convert and compress images. Switch hero images to WebP or AVIF. Use Squoosh, Cloudinary, or your CMS’s built-in optimizer. Set explicit
widthandheightattributes to prevent CLS. - Enable browser caching. Set
Cache-Controlheaders with long max-age values for static assets (CSS, JS, images). Aim for at least one year on versioned files. - Deploy a CDN. Cloudflare, Fastly, or AWS CloudFront serve assets from edge nodes closest to the user, cutting latency without touching your code.
- Remove unused plugins and tags. Every WordPress plugin or Google Tag Manager tag that fires on load adds weight. Audit and cut anything not actively used.
- Limit font weights. Load only the weights you actually use. Swap
font-display: swapto prevent invisible text during font load. - Reduce redirects. Each redirect adds a round-trip. Update internal links to point directly to the final URL.
Engineering fixes (days to weeks)
- Critical CSS: Inline the CSS needed to render above-the-fold content and defer the rest. Tools like Critical or PurgeCSS automate this.
- Defer and async JavaScript: Add
deferto non-critical scripts andasyncwhere execution order doesn’t matter. This frees the main thread for rendering. - Reduce TTFB below 200ms. Moz’s guidance identifies TTFB as a foundational metric. Pre-rendered or statically generated pages served from a CDN consistently hit this target. Heavy client-side rendering rarely does.
- Server-side rendering or static generation. Pre-rendered pages have a baseline advantage on LCP and CLS compared with pages built entirely in the browser. Frameworks like Next.js, Nuxt, or Astro make this achievable without a full rebuild.
- Code splitting: Break large JavaScript bundles into smaller chunks loaded on demand. This directly reduces INP by shrinking the amount of code the browser parses on load.
Third-party script strategy
Third-party tags are the single most underestimated source of INP failures. Audit every tag in Google Tag Manager. For heavy embeds like YouTube videos or chat widgets, replace them with lightweight facades that load the real resource only on user interaction. Defer analytics and ad pixels until after the page’s first interaction.
Pro Tip: To cut INP, focus on reducing long tasks on the main thread. Any JavaScript task running longer than 50ms blocks user interactions. Use Chrome DevTools’ Performance panel to find and break up these tasks. Limiting third-party scripts is often faster than rewriting your own code.
How to prioritize fixes and track progress
Not every fix is worth the same effort. An impact×effort matrix helps you sequence work so the biggest SEO gains come first.
Prioritization order:
- Fix all URLs labeled “Poor” in Search Console before addressing “Needs Improvement.”
- Within “Poor” URLs, sort by impressions. The highest-traffic templates deliver the most SEO return per hour of work.
- Address the dominant failing metric first. If LCP is failing site-wide, image and server fixes take priority over CLS corrections.
- Validate each fix in a staging environment before deploying.
Monitoring checklist:
- Set up Search Console email alerts for Core Web Vitals regressions.
- Add a Lighthouse CI check to your deployment pipeline so every code push is tested against a performance budget.
- Run a third-party tag audit monthly — tag drift is the most common cause of regressions after a site passes CWV.
- Expect field data to reflect improvements within 4–8 weeks after deploying fixes, because CrUX uses a rolling 28-day window.
Tool reference: what to run and what to look for
| Tool | Data Type | What to do |
|---|---|---|
| PageSpeed Insights | Lab + Field | Paste URL; check CrUX field scores first, then Lighthouse diagnostics |
| Lighthouse | Lab | Run in DevTools; look for LCP element, long tasks, unused JS |
| Search Console CWV | Field | Group by URL type; fix “Poor” clusters at template level |
| WebPageTest | Lab | Run on target device; read waterfall for render-blocking resources |
| GTmetrix | Lab | Schedule recurring tests; track LCP and TTFB over time |
| Semrush Site Audit | Lab | Crawl full domain; filter by speed issues to find template patterns |
| Chrome UX Report | Field | Query BigQuery for segment-level CrUX data on large sites |
Key distinction: PageSpeed Insights, Lighthouse, WebPageTest, and GTmetrix are lab tools. Search Console’s Core Web Vitals report and the Chrome UX Report deliver field data. Only field data feeds Google’s ranking system.
Why chasing a perfect score is usually the wrong goal
A Lighthouse score of 100 is a lab artifact. It reflects simulated conditions on a throttled connection with no real users, no personalization, and no third-party scripts running. Chasing it can lead you to strip features that users actually value, like live chat or personalized recommendations, without meaningfully improving your CrUX field data.
What actually matters for ranking:
- LCP ≤ 2.5s in field data (75th percentile)
- INP ≤ 200ms in field data (75th percentile)
- CLS ≤ 0.1 in field data (75th percentile)
A few myth-busting points worth keeping in mind:
- You don’t need a score of 100 to rank. Many top-ranking pages score in the 60–80 range on Lighthouse while passing all three CWV thresholds in field data.
- A page can pass CWV in the field while scoring poorly in Lighthouse, and vice versa. The two are related but not interchangeable.
- Google itself has clarified that content quality and relevance remain the dominant ranking signals. CWV is a tiebreaker, not a trump card.
- Mobile field data is what Google evaluates. A desktop score of 95 with a mobile score of 55 is a problem.
Pro Tip: In competitive verticals where the top five results all have comparable content, getting every key landing page to “Good” on all three CWV metrics in field data is worth the engineering investment. In less competitive niches, fixing “Poor” pages and leaving “Needs Improvement” pages for later is a perfectly rational use of budget.
An agency-style prioritization framework: 7-day and 90-day plans
The impact×effort approach works best when it’s tied to a concrete sequence. Here’s how Theartistevolution structures speed engagements for clients:
7-day quick audit checklist:
- Pull the Search Console Core Web Vitals report and export all “Poor” URLs grouped by template type.
- Run PageSpeed Insights on the top three templates by impressions.
- Run WebPageTest on one representative URL per template; save the waterfall.
- Identify the dominant failing metric for each template (usually LCP for content sites, INP for interactive apps).
- List the top five fixes by impact×effort and assign owners.
- Deploy image compression and CDN changes to staging; validate with Lighthouse.
- Set a performance budget and add Lighthouse CI to the deployment pipeline.
90-day roadmap:
- Weeks 1–2: Deploy quick wins (images, caching, CDN, tag audit). Validate in staging. Push to production.
- Weeks 3–6: Engineering fixes (defer JS, critical CSS, TTFB reduction). Test on real devices.
- Weeks 7–10: Monitor CrUX for field data movement. Expect the 28-day window to start reflecting changes around week 5–6.
- Weeks 11–13: Address remaining “Needs Improvement” URLs. Audit third-party tags again.
For clients who want to see what a structured SEO engagement looks like in practice, the SEO improvement after national relaunch case study shows how a phased technical approach translates into measurable search visibility gains.
What the agency sees fail most often
The pattern that shows up most in client audits is not a missing CDN or an uncompressed image. It’s tag drift: a site passes Core Web Vitals in January, a new marketing campaign adds three pixels and a chat widget in February, and by March the INP score has crossed into “Poor” without anyone noticing. Nobody owns performance after the initial fix.

The second most common failure is unoptimized media added after launch. A designer uploads a 4MB PNG to a hero section, the CMS doesn’t auto-convert it, and LCP jumps from 2.1 seconds to 4.8 seconds overnight.
The fix for both is structural: assign a performance owner, set a performance budget in your CI pipeline, and run a third-party tag audit every month. Speed is not a project with a completion date. It’s a discipline with a recurring calendar entry. For teams that want expert oversight without building that infrastructure internally, a managed SEO agency engagement is often the most cost-effective path.
Theartistevolution’s page speed and SEO services
Theartistevolution delivers full-service page speed and SEO engagements for businesses in healthcare, retail, legal, and beyond. The agency’s approach starts with a structured marketing assessment that identifies your highest-impact speed issues before a single line of code changes.

What a typical page speed engagement includes:
- A full Core Web Vitals audit with field data from Search Console and CrUX
- A prioritized fix roadmap organized by impact×effort and traffic volume
- Implementation support for image optimization, CDN setup, JS deferral, and TTFB reduction
- Performance budget configuration and Lighthouse CI integration
- Monthly monitoring reports with regression alerts
Speed improvements also compound when paired with campaign management and paid media, since faster landing pages improve Quality Score and lower cost-per-click. If you’re ready to move from a failing CWV report to a passing one, request a marketing assessment and get a clear picture of where your site stands and what it will take to fix it.
Sources
Official documentation and tools for going deeper on page speed and Core Web Vitals:
- Core Web Vitals report – Search Console Help
- Page speed – Moz
- Page Speed and SEO: How Speed Affects Rankings (2026) | PageSpeed Matters
- How Core Web Vitals affect SEO – Vercel
- SEO guide 2026: page experience & Core Web Vitals – Bejamas
Lab tools (Lighthouse, WebPageTest, GTmetrix, PageSpeed Insights lab tab) diagnose issues. Field sources (Search Console, CrUX, PageSpeed Insights field tab) confirm whether real users are experiencing the improvements.