
Marketing mix modeling is an aggregate, regression-based measurement method that estimates how much each marketing and non-marketing driver contributes to sales or revenue, then converts those contributions into response curves you can use to reallocate budget. It runs on channel-level spend and impressions, sales or conversion outcomes, and a set of transforms, adstock for carryover and saturation for diminishing returns, that turn raw spend into a defensible estimate of what actually moved the number.
If you’re weighing whether marketing mix modeling (often shortened to MMM, or media mix modeling) is worth building or buying, here’s the fast version:
- Use it when you need to size total channel contribution across TV, paid search, social, retail media, and offline spend at once, not just click-level attribution.
- It reliably answers questions like “what’s our marginal ROI per channel right now” and “where’s the next dollar best spent,” not “did this specific ad impression cause this specific sale.”
- Typical cadence and outputs run quarterly to monthly in modern implementations, producing a contribution decomposition, channel response curves, and scenario forecasts for planning.
- Readiness rule of thumb: most practitioners want at least 18 months of weekly spend data across five or more channels, with model quality checked against diagnostics like MAPE and R².
That’s the shape of it. The rest of this guide walks through the mechanics, the model choices, the data prep, and the implementation path, so you can either run this in-house or brief an agency without getting talked past.
Key Takeaways
Marketing mix modeling works because it converts aggregate spend and outcome data into causal-looking contribution estimates through adstock and saturation transforms, then validates those estimates against holdout tests and, ideally, real experiments.
| Point | Details |
|---|---|
| Check readiness first | Confirm you have 18 or more months of weekly data before committing to a full build. |
| Respect the uncertainty | Never present a single ROI number to leadership without its credible interval attached. |
| Calibrate with experiments | Use incrementality test results as priors to separate nonlinear effects from time-varying ones. |
| Refresh on a real cadence | Move away from once-a-year models toward quarterly or monthly scenario-driven updates. |
| Get a readiness check | Theartistevolution’s marketing assessment diagnoses data maturity and models MMM feasibility before you build. |
Table of Contents
- Why Marketing Mix Modeling Matters Right Now
- How Does Adstock and Saturation Modeling Work?
- Bayesian or Frequentist: Which Estimation Approach Fits?
- What Data Does Marketing Mix Modeling Require?
- How Do You Read Marketing Mix Modeling Outputs?
- What’s the Implementation Timeline for Marketing Mix Modeling?
- How Do You Validate a Marketing Mix Model?
- Which Tools and Vendors Handle MMM Well?
- Should You Build MMM In-House or Hire an Agency?
- How Does an Agency Actually Run an MMM Project?
- What Do Practitioners Get Wrong About Marketing Mix Modeling?
- How Theartistevolution Supports Marketing Mix Modeling Projects
- Where to Learn More About Marketing Mix Modeling
- Frequently Asked Questions
- Sources
Why Marketing Mix Modeling Matters Right Now
MMM answers a set of business questions that channel-level attribution simply can’t touch. It tells you the total contribution of every driver, marketing and non-marketing, working simultaneously. It tells you where budget is under or overinvested relative to marginal return. It separates long-term brand effects from short-term promotional lifts. And it forecasts what happens to revenue under different spend scenarios before you commit the dollars.
That capability has become more valuable, not less, as tracking has gotten harder. Cookie deprecation and platform-level privacy changes have eroded the reliability of user-level attribution, which is a big part of why Gartner frames modern MMM as a shift toward privacy-resilient, scenario-driven measurement rather than the slow, annual academic exercise it used to be. MMM works on aggregate data, so it doesn’t care whether a cookie fired or a device ID resolved. It also covers the channels that never had pixel-level tracking to begin with: linear TV, out-of-home, radio, print, and in-store promotions.
That’s showing up in how marketers actually rate the method. EMARKETER and TransUnion data show 27.6% of US brand and agency marketers already consider MMM the most reliable measurement methodology available, and 46.9% plan to increase their investment in it. That’s not a niche technique anymore. It’s becoming a default layer in the measurement stack.
A few concrete use cases where MMM earns its keep:
- CPG campaign planning: sizing the combined effect of national TV, digital video, and retail media against seasonal demand swings.
- Retail promo optimization: isolating how much of a same-store sales lift came from a price promotion versus concurrent paid media.
- Cross-channel budget allocation: reallocating spend from a saturated channel to an underfunded one based on marginal response, not last-click credit.
- Offline-to-online halo effects: quantifying how TV or out-of-home spend lifts branded search volume, something click-based attribution structurally can’t see.
Run well, an MMM program produces a specific set of business outcomes: a defensible budget reallocation plan, a rolling forecast tied to spend scenarios, and a shared set of KPIs that finance and marketing actually agree on. That last one matters more than it sounds. A lot of measurement debates inside companies are really disagreements about which number to trust, and MMM gives both sides a model they built together.
How Does Adstock and Saturation Modeling Work?
The mechanics that separate MMM from a simple correlation chart are adstock, saturation, and lag structure. Get these wrong and your model will still produce a number, it just won’t be the right one.
Adstock models advertising carryover. A dollar of TV spend this week doesn’t stop working the moment the ad airs. It decays over subsequent weeks according to a half-life specific to the channel. The basic geometric decay formula looks like this:
Adstock(t) = Spend(t) + λ × Adstock(t−1)
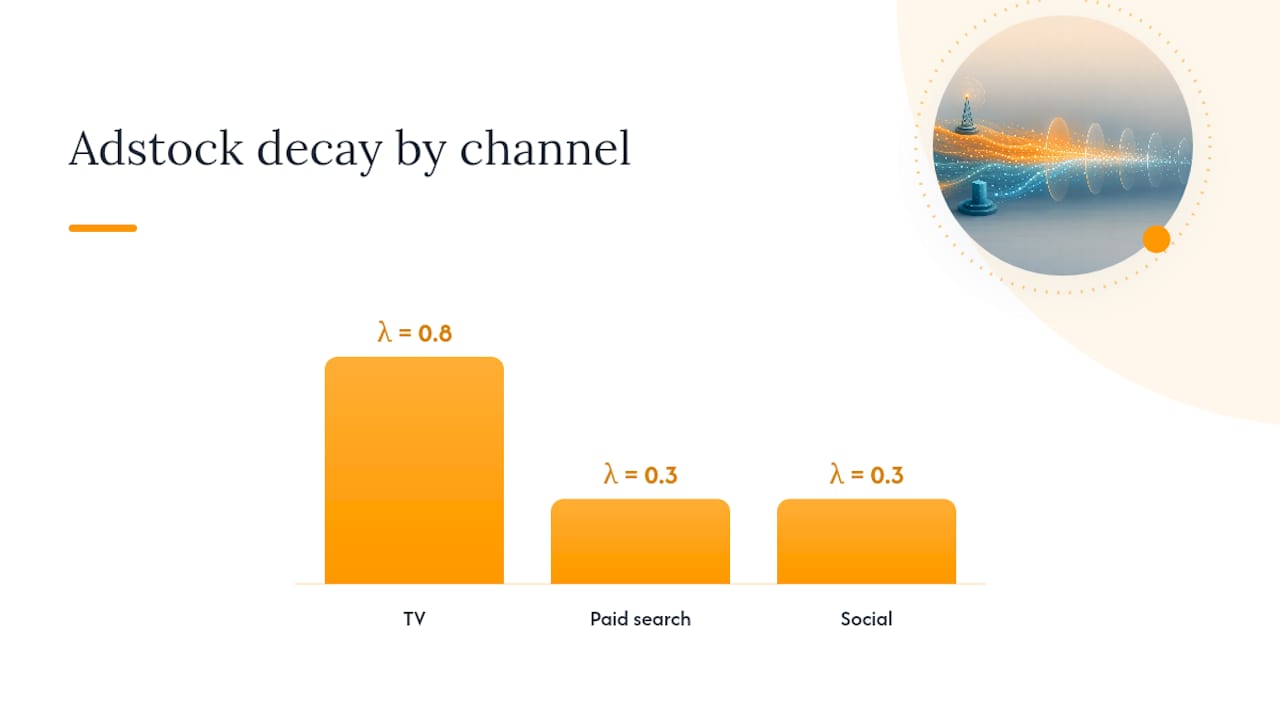
where λ (lambda) is the decay rate between 0 and 1. A channel with λ = 0.8 carries more memory week over week than one with λ = 0.3. TV typically shows longer carryover than paid search or social, which tend to saturate and decay faster, and that difference alone can change how you weight a reallocation decision.
Saturation captures diminishing returns: the tenth dollar into a channel almost never buys as much incremental outcome as the first. Modern MMM implementations commonly use Hill, Michaelis-Menten, or logarithmic functional forms to model this curve, and the shape you choose isn’t cosmetic. A Hill curve with a steep inflection point implies a hard ceiling on a channel’s usefulness; a gentler logarithmic curve implies room to keep scaling. Pick the wrong shape and your reallocation advice will be wrong in the direction that costs the most money.
Beyond adstock and saturation, a full specification needs:
- Lag structure for delayed effects, since some channels influence purchase decisions weeks after exposure, not just the same week.
- Seasonality controls, usually Fourier terms or holiday dummies, to keep seasonal demand from getting misread as channel performance.
- External covariates like price changes, distribution shifts, competitor activity, and macroeconomic indicators, all of which compete with marketing for credit in the outcome variable.
Pro Tip: Don’t estimate adstock decay and saturation shape from thin air. A single well-designed holdout test is worth more than a dozen analyst assumptions.
Bayesian or Frequentist: Which Estimation Approach Fits?
Once the transforms are set, you have to pick how the model gets estimated, and this choice shapes everything from interpretability to how much compute you need.
At a glance, most MMM specifications fall into a few families: log-linear regression models (simple, interpretable, weak on nonlinear interaction), multiplicative models (good for modeling elasticities directly), hierarchical models (useful when you’re pooling data across multiple markets or brands), and Gaussian process based models (flexible but compute-heavy and harder to explain to a CFO).
The bigger fork in the road is Bayesian versus frequentist estimation. Frequentist regression is faster, simpler, and familiar to most analysts, but it struggles with multicollinearity, a real problem when TV and digital spend often move together, and it doesn’t naturally produce uncertainty ranges stakeholders can act on. Bayesian estimation has become the default in enterprise practice because it lets you inject priors from past experiments or industry benchmarks, which stabilizes coefficients and produces credible intervals instead of a single brittle point estimate. The tradeoff is compute cost and a steeper learning curve for the team maintaining it.
Calibration is where the choice earns its value. If you’ve run incrementality tests on paid search or social, feed those results in as informative priors rather than letting the model discover coefficients from correlation alone. Constraining a coefficient’s sign, so a channel can’t come back with a negative contribution that makes no business sense, is a basic but frequently skipped calibration step.
Quick rules for picking a method:
- Small team, single market, tight timeline: frequentist regression with well-chosen priors on adstock and saturation gets you 80% of the value at a fraction of the setup cost.
- Multiple markets or brands sharing structure: hierarchical Bayesian models let you borrow strength across markets without treating each one as an island.
- High stakes, high budget, low tolerance for a wrong allocation call: full Bayesian with experiment-informed priors is worth the extra build time.
What Data Does Marketing Mix Modeling Require?
Data quality is where most MMM projects quietly fail. The model can only be as honest as what you feed it, and marketing data is notoriously messy across systems, taxonomies, and time zones.
| Input | Modeling Purpose | Typical Granularity |
|---|---|---|
| Media spend by channel | Primary independent variable for each channel’s contribution | Weekly, by channel and market |
| Impressions or GRPs | Alternative exposure metric when spend is a poor proxy for reach | Weekly, by channel |
| Sales or conversions | Dependent variable the model explains | Weekly or daily, by market |
| Price | Controls for demand shifts unrelated to marketing | Weekly, by product or market |
| Promotions | Isolates promo lift from underlying media effect | Weekly, flagged by type |
| External covariates (weather, competitor activity, macro indicators) | Prevents confounding between marketing and outside demand drivers | Weekly, by market |
Before any of that data goes into a model, run it through a cleaning checklist:
- Align campaign taxonomy across platforms so “paid social” means the same thing in every data source.
- Reconcile spend timing, booked versus delivered, so budget dollars land in the week the exposure actually happened.
- Handle missing weeks and outliers explicitly rather than letting a data gap silently distort a coefficient.
- Confirm the outcome metric (revenue, units, leads) is consistent across the full historical window, not redefined halfway through.
On readiness: the commonly cited threshold is 18 or more months of weekly data across five or more channels, with $3 million or more in annual spend or enough spend variance to identify a response curve. Below that, you’re better off running a lighter diagnostic, something like Theartistevolution’s marketing assessment, before committing to a full model build.
One privacy note worth stating plainly: because MMM works on aggregated, channel-level totals rather than individual user records, it sidesteps most of the consent and data-sharing friction that plagues user-level tracking, though internal data-sharing agreements between teams and vendors still deserve a real look before data starts moving.
How Do You Read Marketing Mix Modeling Outputs?
A finished model produces four things you’ll actually use: a contribution decomposition, marginal response curves, elasticities and ROI figures (sometimes reported as miROAS, marginal incremental return on ad spend), and scenario forecasts.

The decomposition splits historical sales into base (what would have happened with zero marketing) and incremental (what each channel added). Response curves show, for a given channel, how outcome changes as spend changes, and this is where the saturation shape from earlier becomes actionable: the inflection point on that curve is roughly where you stop getting proportional value from additional spend. Elasticities translate that curve into a percentage: a 1% increase in spend yields some percentage lift in outcome, holding everything else constant.
Credible intervals are the part stakeholders most often ignore and most need to respect. A channel with a wide, overlapping-zero credible interval isn’t a channel you should confidently defund or double down on. It’s a channel you should test. Treating a Bayesian point estimate as gospel, when the interval around it spans a huge range, is one of the most common and costly misreads of an MMM output.
For a stakeholder-facing report, a few visuals do most of the work:
- A decomposition chart (often a stacked area or pie) showing base versus incremental contribution by channel.
- Response curves per channel with the current spend level marked, so leadership can see exactly where they sit on the curve.
- A scenario forecast chart comparing two or three budget allocation options against a baseline.
Dos and don’ts worth pinning to the wall: don’t present a single ROI number without its interval. Don’t let last quarter’s coefficient get treated as a permanent truth; consumer behavior and channel costs shift, and the model should be refreshed accordingly. Do show the base sales line explicitly, since a surprising number of stakeholders don’t realize how much of revenue is happening independent of any marketing at all.
What’s the Implementation Timeline for Marketing Mix Modeling?
Most MMM builds move through six phases, and the pace depends heavily on how many markets, channels, and data sources are in scope.
| Phase | Typical Duration | Primary Output |
|---|---|---|
| Scoping | 1 week | Model spec, KPI definitions, data audit |
| Data preparation | 3 weeks | Cleaned, aligned dataset with taxonomy mapping |
| Model build | 2 weeks | Initial fitted model with priors set |
| Validation | 1 to 3 weeks | Diagnostics report, holdout results |
| Deployment | 1 week | Scenario workbook, stakeholder playbook |
| Ongoing monitoring | Continuous | Refreshed coefficients, quarterly updates |
The biggest cost and time drivers aren’t the modeling itself, they’re everything around it: data engineering to reconcile disparate platform exports, the number of channels and markets under analysis (each added market roughly multiplies the data prep burden), whether you’re running new incrementality experiments to inform priors, and any custom features like weather data or competitor spend tracking.
At each phase, expect a specific deliverable: a written data spec before build starts, a model spec documenting every transform and assumption, a diagnostics report before anyone acts on outputs, a scenario workbook that lets planners test allocation options themselves, and a decision playbook that translates model language into media-buying language.
Pro Tip: If you want to compress this timeline without cutting corners, automate the data pipeline first. A repeatable ETL process that pulls spend and outcome data on a schedule, paired with templated priors by channel type, can cut model refresh cycles from months to weeks. Tools like Sendmux’s automation infrastructure illustrate the kind of pipeline thinking that applies well to MMM data refresh cycles, even though it’s built for a different use case.
How Do You Validate a Marketing Mix Model?
Before anyone acts on a model’s output, it needs to pass a real diagnostic checklist, not just “the numbers look reasonable.”
- MAPE (mean absolute percentage error) under roughly 10 to 15% on holdout weeks is a common bar for a usable model.
- R² in the 0.7 to 0.9 range, though a very high R² on its own can signal overfitting rather than genuine fit.
- Holdout tests, where the model is trained on part of the history and checked against weeks it never saw.
- Posterior predictive checks for Bayesian models, confirming the model’s simulated outcomes resemble actual historical patterns.
- Coefficient sign checks, making sure no channel comes back with an implausible negative contribution.
- R-hat statistics near 1.0 for Bayesian chains, confirming the sampler actually converged rather than wandering.
When diagnostics fail, don’t patch the output, revisit the spec. A high MAPE often traces back to a missing covariate (a competitor launch, a stockout) rather than a flaw in the estimation method itself.
The deeper limitation to sit with is that MMM shows correlation-shaped evidence dressed up in a causal-looking framework. That’s not a flaw unique to MMM, it’s the nature of working with aggregate observational data. The sharpest version of this problem is that nonlinear response effects and time-varying effectiveness are often not separately identifiable from standard aggregate data, meaning a model can conflate “this channel has diminishing returns” with “this channel got less effective over time,” and land on fundamentally different, and sometimes contradictory, allocation advice depending on which story it happens to fit.
Experiments are the fix. A geo holdout test, a matched-market test, or a simple platform lift study gives you a real causal anchor that the model can be checked against, and ideally calibrated with directly.
Pro Tip: Design a minimal separation test before you trust a model’s read on a channel that’s both scaling and changing in effectiveness at the same time. Hold spend flat in a subset of markets for four to eight weeks while it scales elsewhere. If the flat-spend markets show a real shift in outcome, you’re looking at a time-varying effect, not a saturation curve, and that distinction changes what you do with your budget next quarter. Theartistevolution’s incrementality testing guide walks through how to structure a test like this.
Which Tools and Vendors Handle MMM Well?
The tooling landscape breaks into four broad categories, and each fits a different stage of organizational maturity.
- Open-source libraries: Python and R based packages built for teams with in-house data science capacity who want full control over model specification and are comfortable maintaining the pipeline themselves.
- Cloud-native MMM suites: platform tools that bundle data ingestion, model fitting, and scenario dashboards into one interface, trading some flexibility for speed.
- Analytics consultancies and full-service agencies: teams that bring modeling expertise plus the strategic layer, translating model output into media plans and creative decisions.
- In-house custom platforms: built by large organizations with dedicated data science teams and enough scale to justify the maintenance overhead.
Selection criteria worth running through before you commit to any category:
- Can it integrate cleanly with your existing data sources without months of custom pipeline work?
- Is the model transparent, can you see the actual adstock and saturation parameters, or is it a black box?
- Does the scenario planning interface let non-technical stakeholders test allocation ideas themselves?
- What’s the refresh cadence, and does the compute cost scale reasonably as you add channels or markets?
- Does it support incorporating experiment results as priors, or does it only run on observational data?
If you’re running a proof-of-concept procurement process, ask any vendor or agency for a sample validation report before signing anything, a real diagnostics output, not a sales deck. Request a defined SLA on refresh cadence and a written plan for how experiment results get folded into future model runs. Theartistevolution’s marketing tools page outlines the kind of integration and reporting infrastructure a pilot request should be checking for.
Should You Build MMM In-House or Hire an Agency?
The build versus buy decision comes down to three things: data maturity, internal bench strength, and how fast you need a usable answer.
Assess internal readiness honestly first:
- Do you have clean, historical spend and outcome data across channels, or would month one be spent just reconciling spreadsheets?
- Is there engineering capacity to build and maintain a data pipeline, not just a one-time export?
- Does your analytics team have Bayesian or advanced regression experience, or would this be a first attempt?
- Is there budget allocated for incrementality experiments to calibrate the model, or will it run on observational data alone?
That expertise gap is common. 45% of organizations cite a lack of internal expertise as their primary barrier to implementing MMM, which is a big part of why so many teams end up hiring out this specific capability even when they keep other analytics work in-house.
If you’re evaluating a vendor or agency, a short list of questions separates a real partner from a slide deck:
- What’s your delivery cadence, monthly refreshes, quarterly, or a one-time annual model?
- Can you show us a sample diagnostics report from a past engagement?
- How do you set priors, and will you incorporate our own incrementality test results if we have them?
- What does the handoff look like, do we get a workbook we can run ourselves, or are we locked into your dashboard?
- What’s your plan when a channel’s diagnostics fail, respec the model or just report the number anyway?
As a rough heuristic: build in-house when you have long-term scale, proprietary data worth protecting, and a team that can maintain the pipeline for years, not just one project cycle. Hire out when you need speed, lack the specific Bayesian modeling expertise, or you’re piloting in a single market before deciding whether to invest further.
How Does an Agency Actually Run an MMM Project?
Here’s what a typical engagement looks like end to end, using an anonymized version of the kind of work a full-service agency delivers for a multi-channel retail or CPG client.
The problem usually starts the same way: a client is running five to seven channels, has a rough sense that some are underperforming, but no defensible way to prove it or reallocate against it. The approach begins with a data audit and readiness assessment, similar to the diagnostic used in Theartistevolution’s retail marketing assessment, followed by taxonomy alignment across ad platforms and point-of-sale systems. The core method is a Bayesian regression model with channel-specific adstock decay and Hill-function saturation curves, calibrated against any past promotional holdout data the client already has on hand.
Deliverables that land on the client’s desk by the end of the engagement typically include:
- A written model specification documenting every transform, prior, and covariate.
- A diagnostics dashboard showing MAPE, R², and holdout accuracy in plain terms.
- A budget scenario workbook letting the client’s own team test reallocation ideas without touching the underlying code.
- An implementation playbook translating model output into specific media-buying and negotiation guidance.
A realistic client-facing timeline runs eight to twelve weeks from kickoff to first decision-ready recommendation, with success measured less by a single big number and more by whether leadership actually trusts the model enough to shift budget on its advice. That trust milestone, honestly, is the harder one to hit than the modeling itself. A campaign like the one behind Theartistevolution’s brand engagement work shows what happens once that budget confidence translates into an actual creative and media shift, not just a report that sits in a folder.
What Do Practitioners Get Wrong About Marketing Mix Modeling?
The biggest governance failure in MMM programs isn’t a bad model, it’s a good model nobody trusts. Analysts build something statistically sound, present it once, and then watch leadership quietly keep making budget decisions the old way because the model felt like a black box. If you want MMM to actually change how money moves, buy-in has to happen before the model exists, not after.
Set expectations early and set them honestly. MMM will not tell you exactly why a specific customer converted. It will not replace click-level attribution for tactical, day-to-day bidding decisions. What it will do is give you a defensible view of total contribution across channels that click-based tools structurally cannot see. Say that plainly in the first stakeholder meeting, because the single most common interpretation error is treating a channel’s MMM coefficient as a precise, permanent truth rather than a probabilistic estimate that should update every quarter.
The other recurring mistake is treating MMM as a standalone oracle instead of one leg of a three-legged stool. The strongest measurement setups triangulate MMM’s aggregate view with incrementality testing’s causal precision and platform attribution’s tactical granularity, and enterprise teams increasingly use exactly that combination to validate and calibrate their models rather than picking one method and defending it against the others. If your MMM output disagrees sharply with a recent holdout test, that’s not a reason to distrust the test, it’s a signal to go back and respec the model.
Operationalizing scenario outputs is where most of the value gets left on the table. A scenario workbook that only the analytics team can open isn’t operational, it’s decorative. Build the handoff so a media planner can adjust a channel’s budget and immediately see the modeled effect on the forecast, without needing to ping the data team every time.
How Theartistevolution Supports Marketing Mix Modeling Projects
If you’ve read this far and you’re weighing whether to run this in-house, Theartistevolution builds and operationalizes MMM engagements for clients across retail, healthcare, legal, and CPG who need the modeling done right without hiring a dedicated data science team from scratch.

The scope typically starts with a data readiness audit, the same kind of diagnostic outlined in the marketing assessment service, followed by model build, validation against holdout data, scenario workbook delivery, and ongoing monitoring as spend patterns shift. On the client side, you provide historical spend, sales, and campaign data; Theartistevolution handles the taxonomy cleanup, model specification, and the translation of coefficients into a plain-language playbook your media buyers can actually use. A typical engagement runs eight to twelve weeks from kickoff to first decision-ready recommendation, with quarterly refreshes after that to keep priors current as channel costs and audience behavior change.
Once the model is producing reallocation recommendations, campaign management picks up where the modeling leaves off, turning the scenario workbook’s numbers into actual media shifts across channels. If you’re ready to see whether your current data supports a reliable model, request a marketing assessment and get a straight answer on where you stand before committing budget to a full build.
Where to Learn More About Marketing Mix Modeling
For readers who want to go deeper into the theory, diagnostics, or implementation mechanics covered here, these sources are worth the time:
- Your MMM is Broken: Identification of Nonlinear and Time-varying Effects in Marketing Mix Models covers the identification problem in technical depth and is the strongest read on why experiments matter for calibration.
- What Is Marketing Mix Modeling? | Ipsos MMA offers a practitioner-level primer on the standard modeling workflow and common adoption barriers.
- Marketing Mix Modeling Guide 2026 | MMM Explained is a solid reference for readiness benchmarks and Bayesian estimation basics.
- What Is Marketing/Media Mix Modeling (MMM)? 2026 MMM Guide makes the case for triangulating MMM with incrementality testing and attribution.
- Marketing mix modeling – Gartner frames the broader industry shift toward modern, privacy-resilient MMM.
Frequently Asked Questions
What is marketing mix modeling used for?
Marketing mix modeling estimates the incremental contribution of each marketing and non-marketing driver to sales or revenue, then produces response curves you can use to reallocate budget across channels and forecast outcomes under different spend scenarios.
How is MMM different from incrementality testing?
MMM works on aggregate historical data and covers every channel at once, including offline media, but it relies on statistical inference rather than a controlled experiment. Incrementality testing isolates one channel’s causal effect through a holdout or lift study, giving you a precise, experiment-based answer for that channel alone. The two work best together, with experiment results calibrating the model’s priors.
How much data do I need to run a reliable MMM?
A common rule of thumb calls for at least 18 months of weekly spend data across five or more channels, along with enough spend variance in each channel to identify a response curve. Below that threshold, model outputs tend to carry wide, unreliable uncertainty ranges.
Is marketing mix modeling still relevant given privacy regulation?
It’s more relevant now, not less. MMM runs on aggregate, channel-level data rather than individual user records, which makes it resilient to cookie deprecation and platform tracking restrictions that have degraded user-level attribution.
Should a small or mid-size company build MMM in-house?
Usually not without existing Bayesian modeling expertise on staff. A lack of internal expertise is the most commonly cited barrier to adoption, which is why many mid-size teams pilot with an agency or consultancy before deciding whether to bring the capability in-house long term.
Sources
- Marketing Mix Modeling Guide 2026 | MMM Explained
- Your MMM is Broken: Identification of Nonlinear and Time-varying Effects in Marketing Mix Models
- Marketing mix modeling – Gartner